This use case was co-created by academic researchers and Drylab. The full chat conversation demonstrates how researchers interact with Drylab to perform analyses, ask questions, and adapt workflows as new insights emerge.
We hope these examples inspire new approaches and possibilities in your own research.
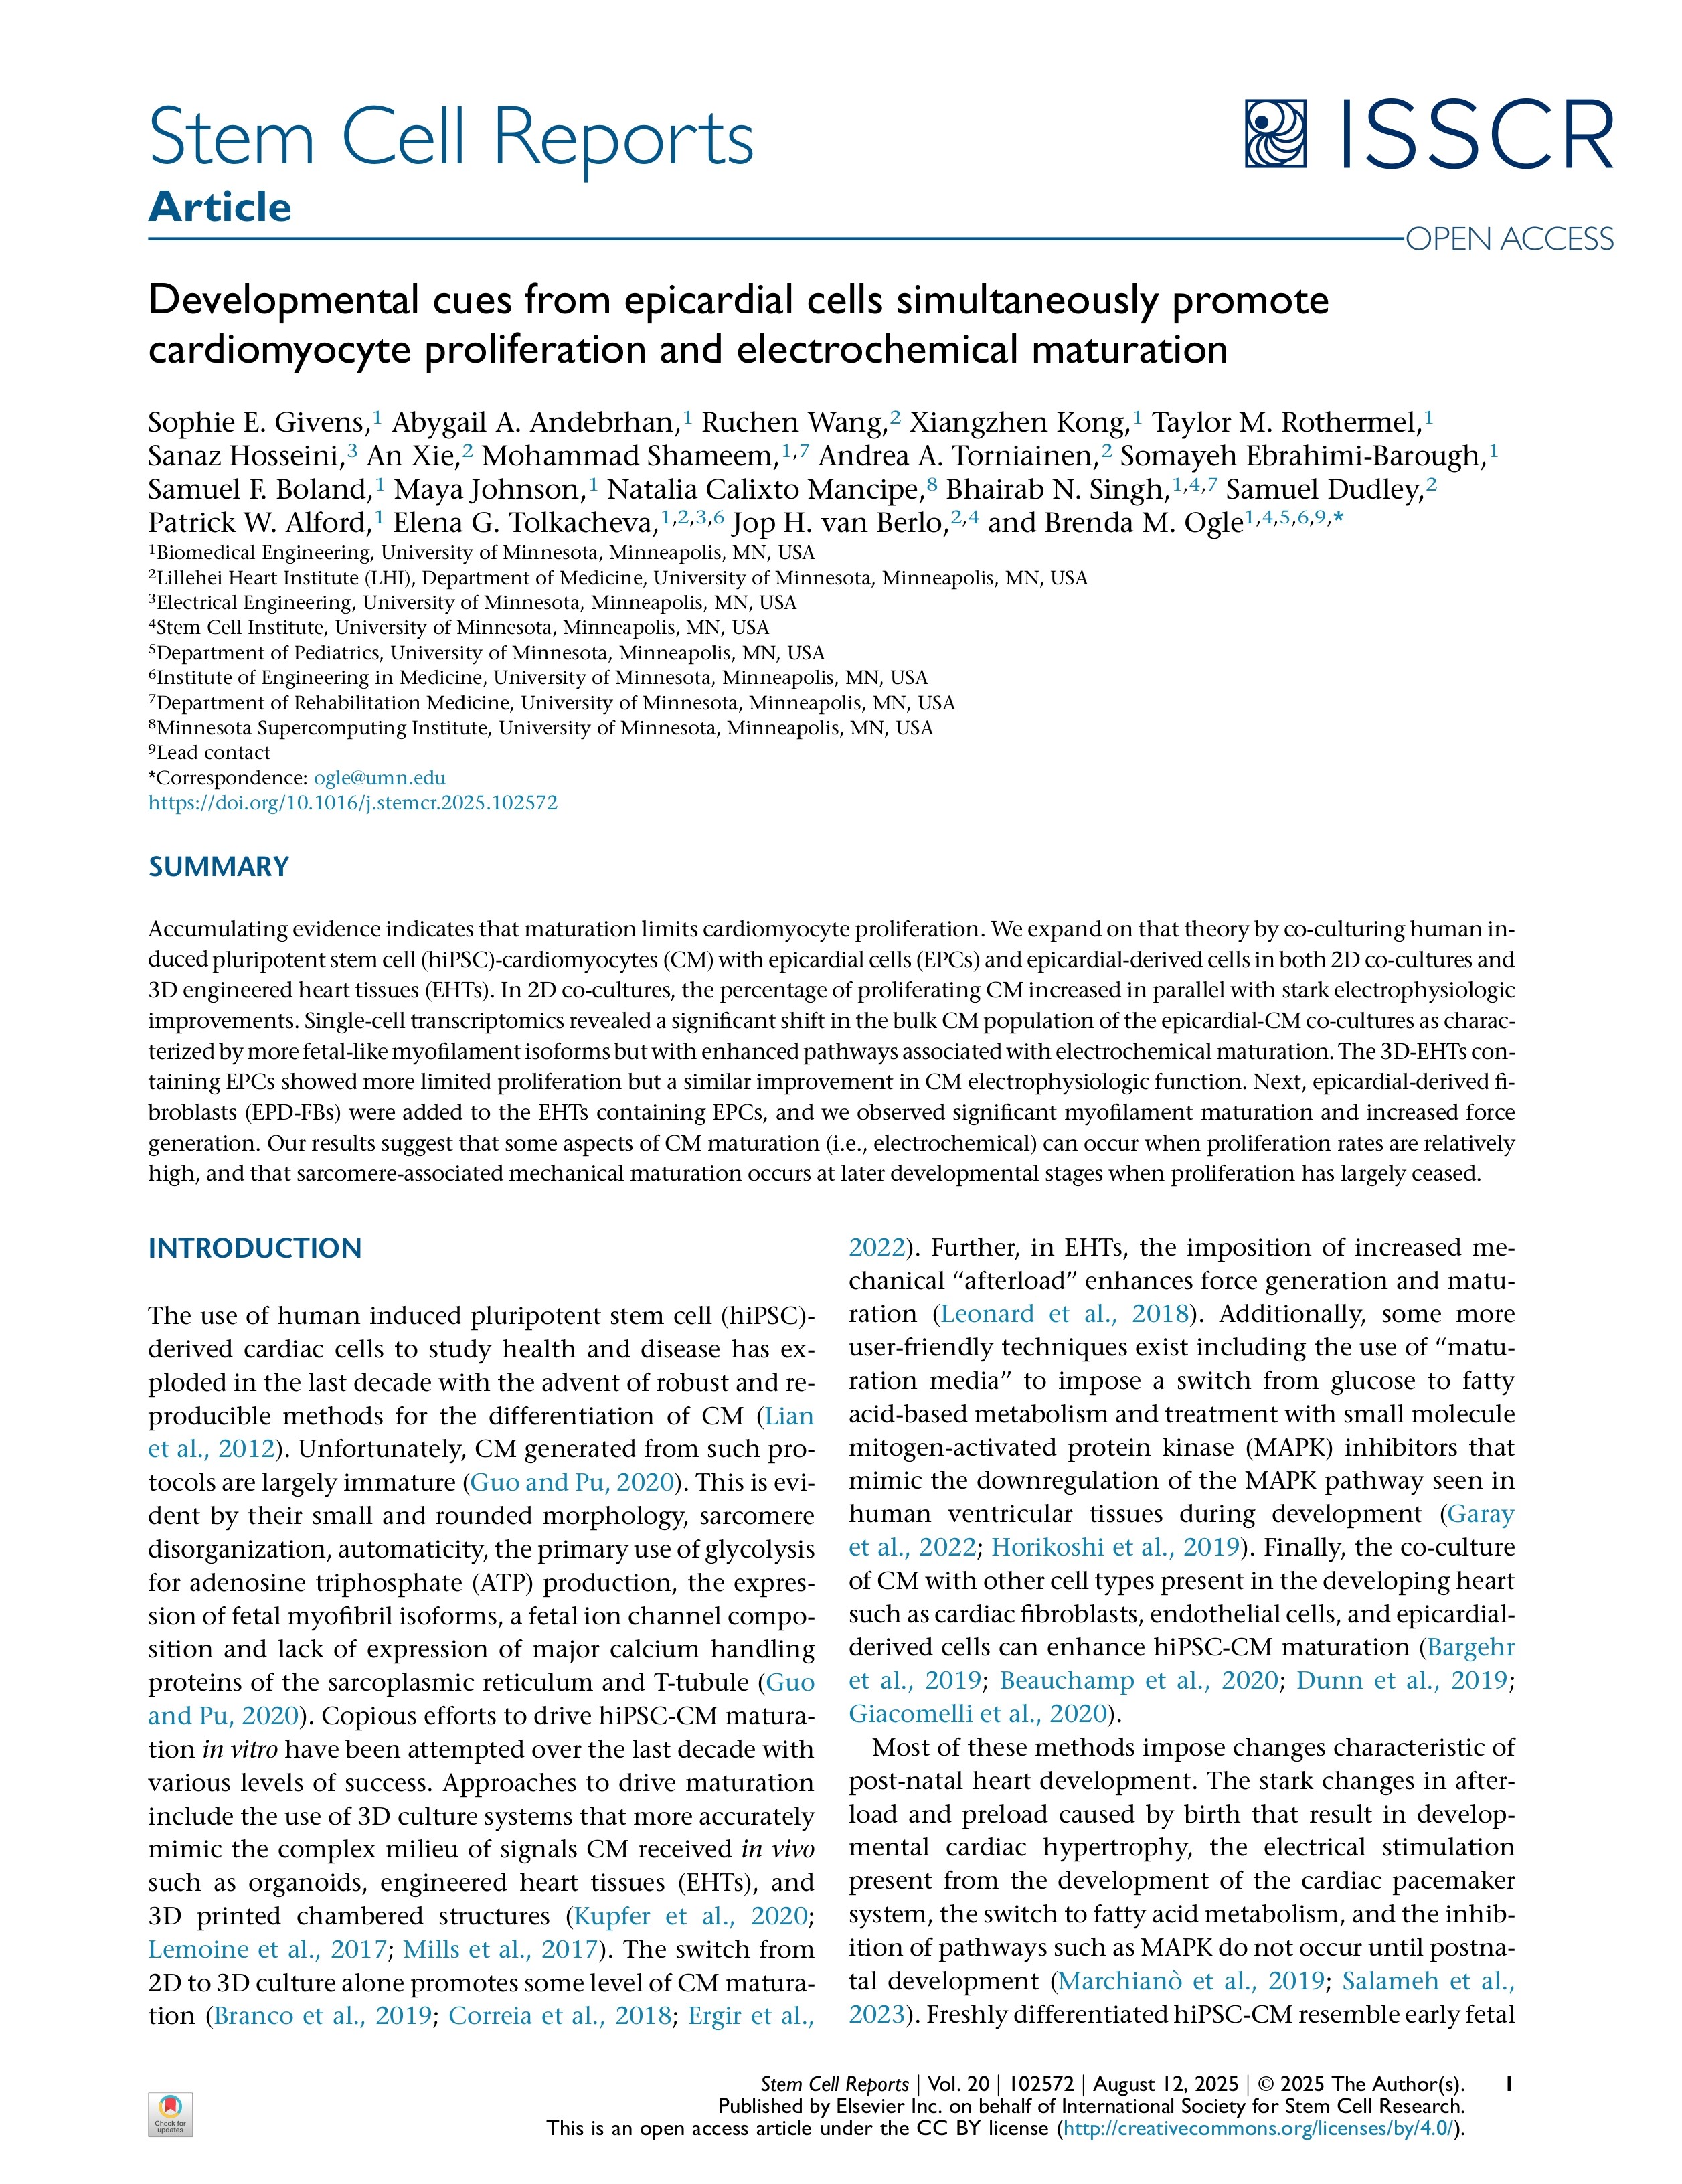
原始论文:来自心外膜细胞的发育信号同时促进心肌细胞增殖和电化学成熟
分析框架
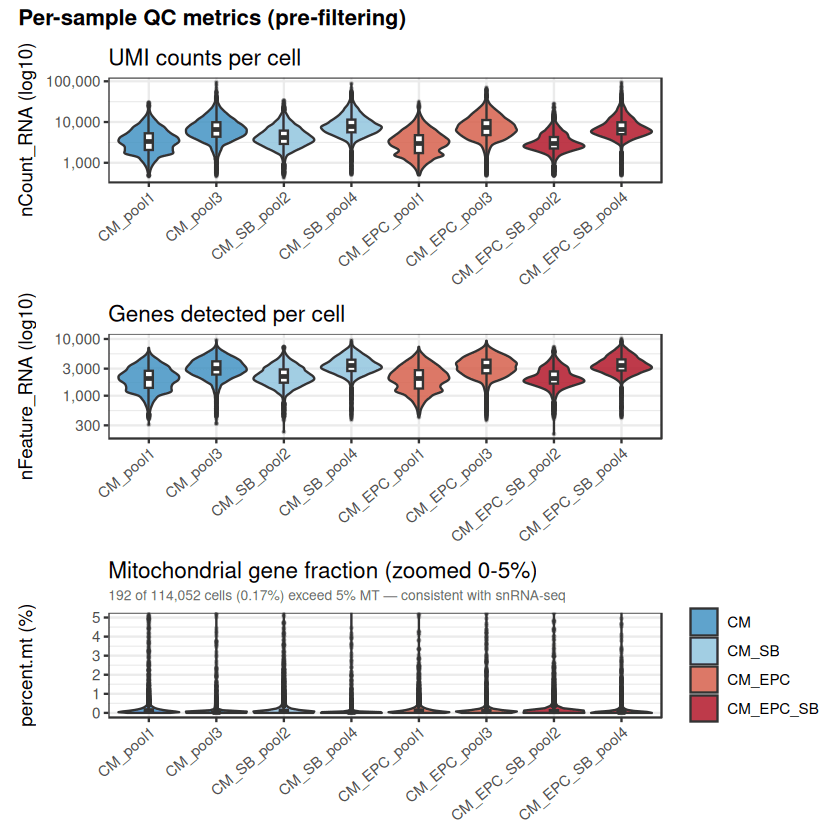
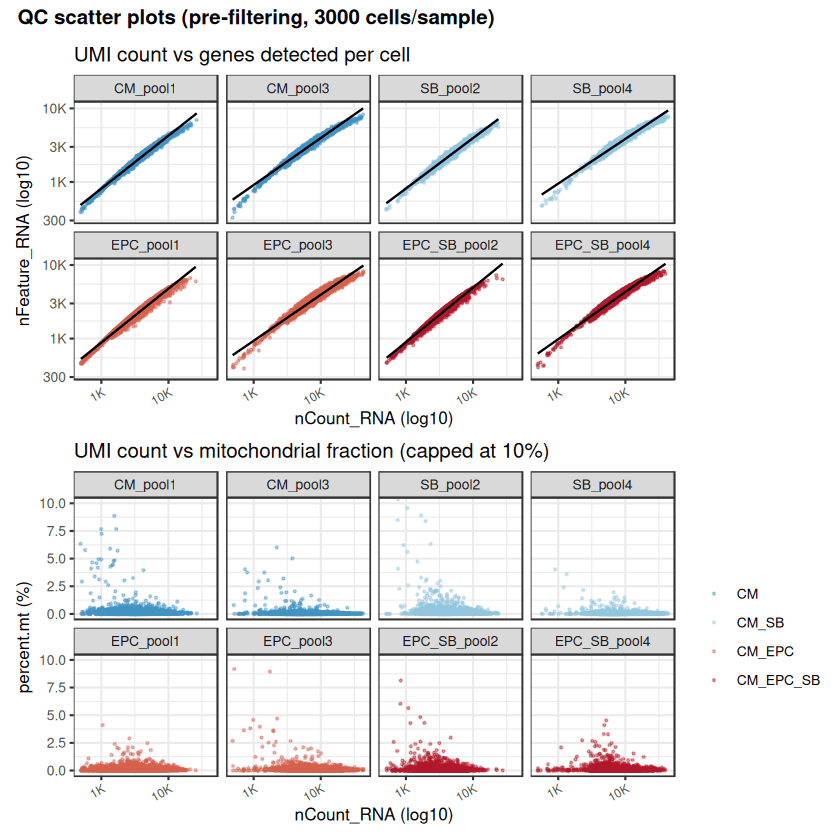
独立 QC 过滤(nFeature、percent.mt)证实了已提交 GEO 数据集(GSE293435)的稳健性。
Drylab 分析在各条件(CM-only、EPC+SB、EPC→DC)下的细胞产量高度一致。
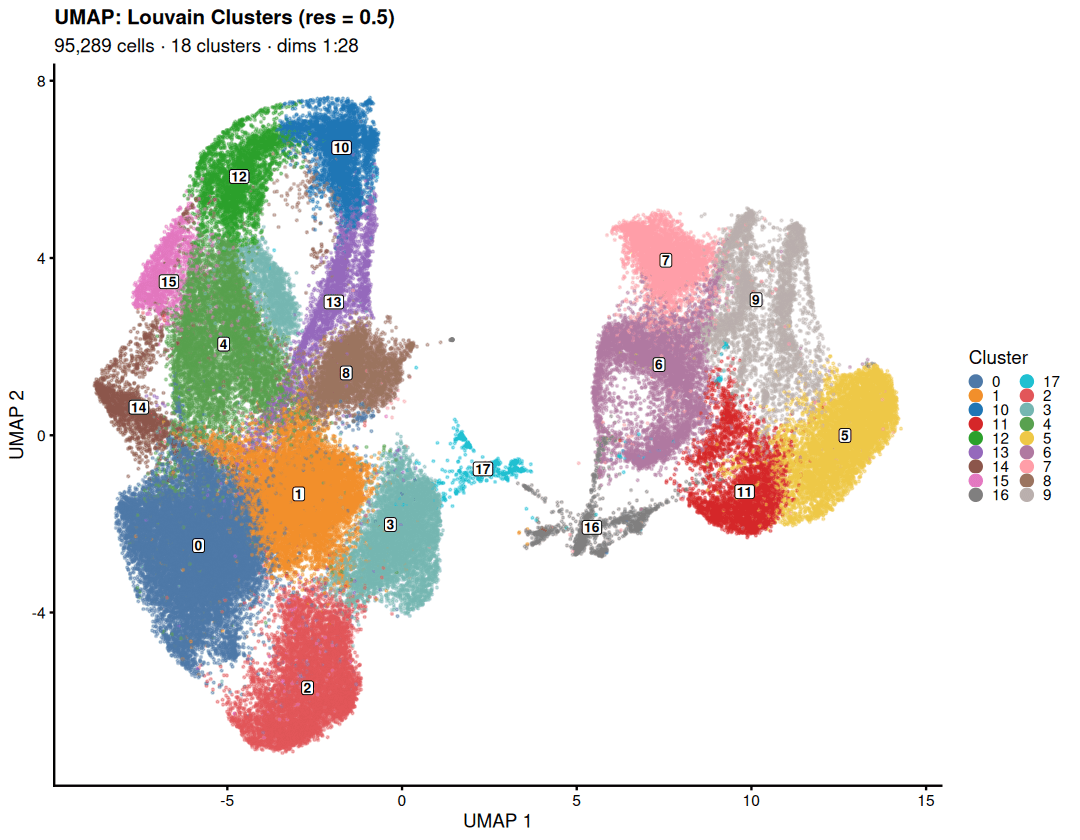
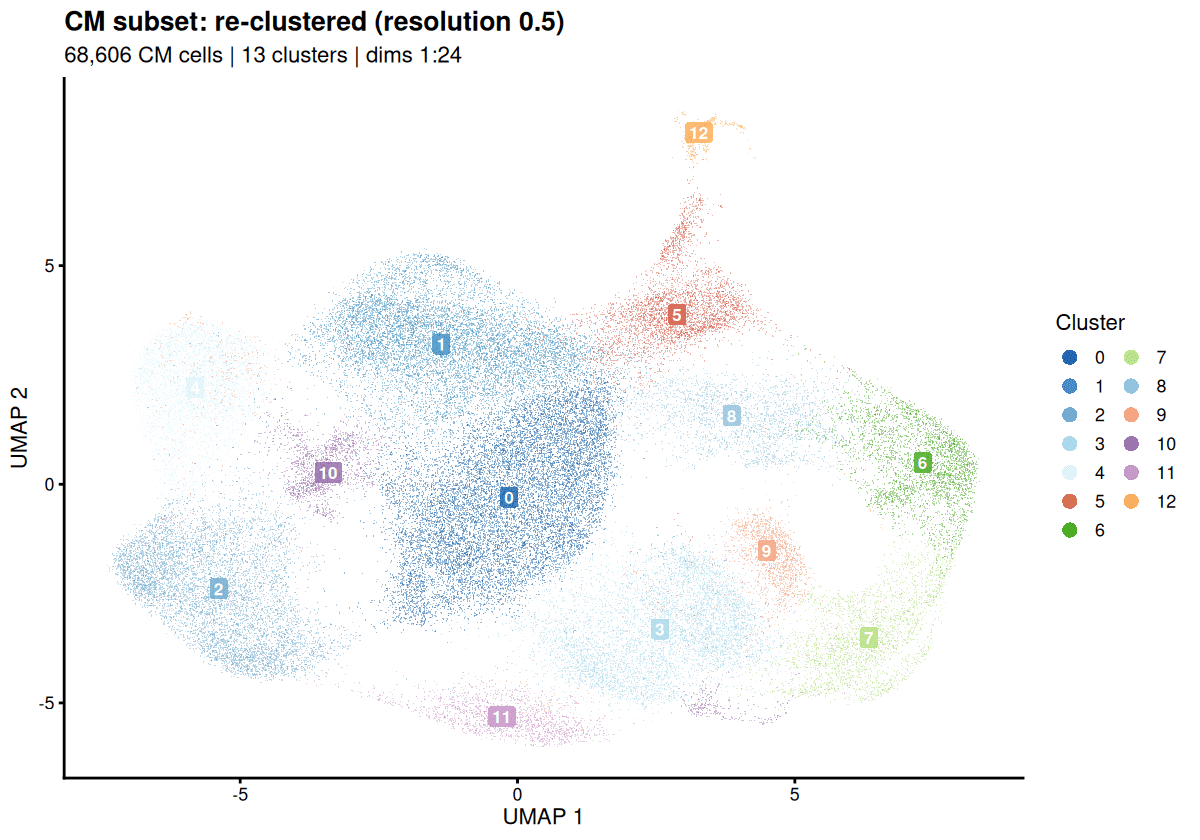
高分辨率细胞类型映射
Drylab 的基于图的聚类与论文中对室性、房性和增殖性心肌细胞的鉴定完全一致。
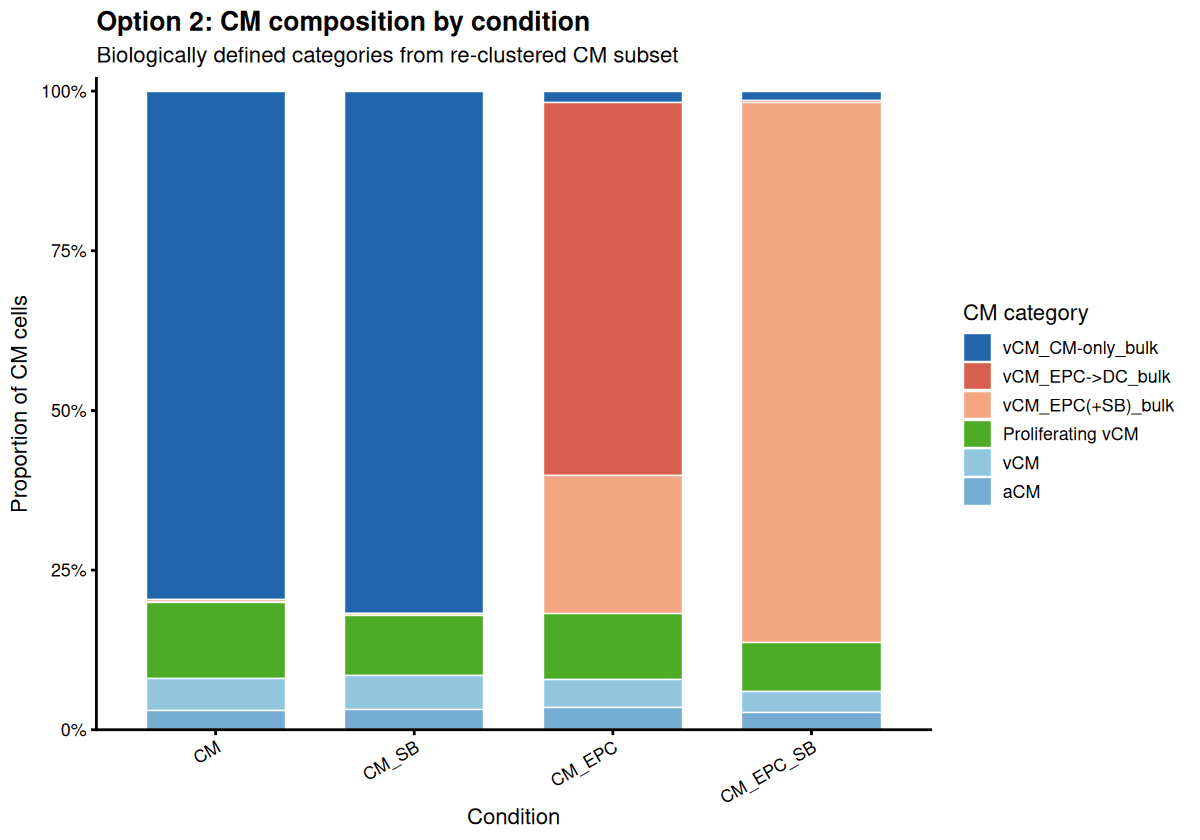
条件特异性心肌细胞组成
证实 EPC(+SB) 共培养主要产生一个独特的具传导能力簇。
Drylab 量化显示,EPC→DC 共培养将约 60% 的心肌细胞推向结构重塑状态,验证了论文的主要表型观察。
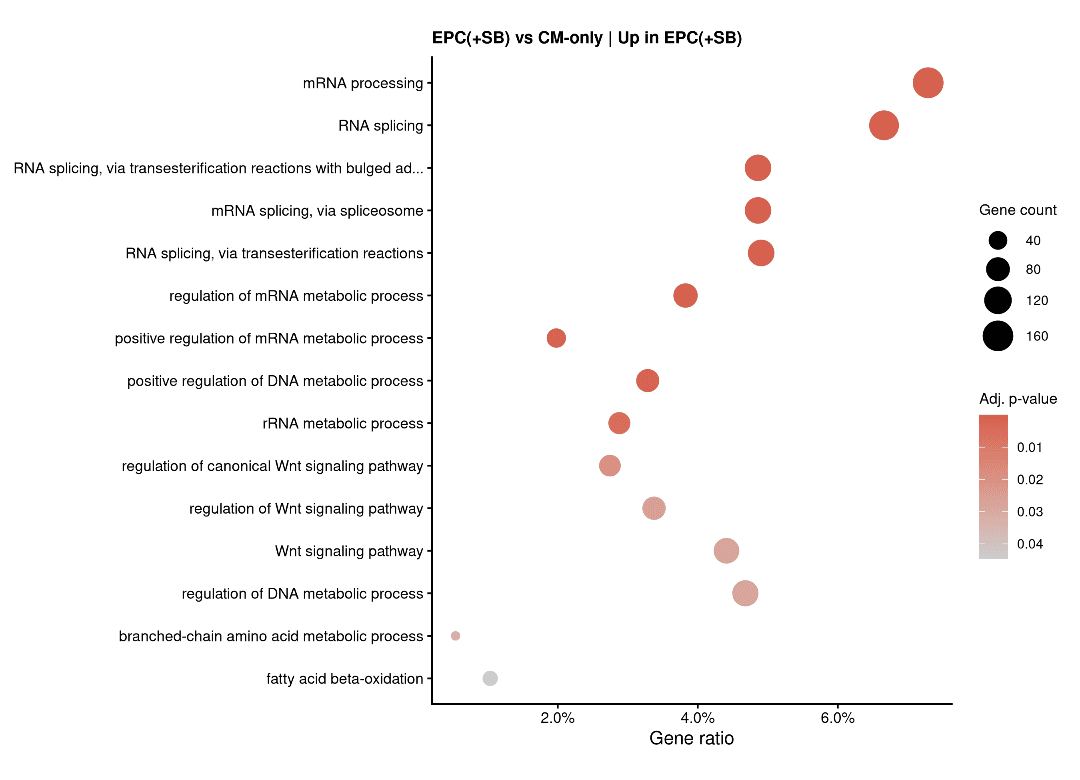
增殖 vs. 成熟轴(EPC+SB)
GO 分析证实了论文中描述的 WNT 信号上调是增殖的驱动因素。
识别出 SOX3 和 ID3 是该增殖状态的主要转录驱动因子。
基因 | log2FC | 校正后 p 值 | % EPC(+SB) | % CM-only |
|---|---|---|---|---|
SOX3 | 3.75 | <0.001 | 15.5% | 1.9% |
CYP26B1 | 3.62 | <0.001 | 11.4% | 1.3% |
ID3 | 3.59 | <0.001 | 29.3% | 4.4% |
NRP2 | 3.31 | <0.001 | 11.7% | 1.6% |
DCN | 3.28 | <0.001 | 28.8% | 4.9% |
PODXL | 3.24 | <0.001 | 10.9% | 1.7% |
表:上调前 10 个基因 - EPC(+SB) vs CM-only
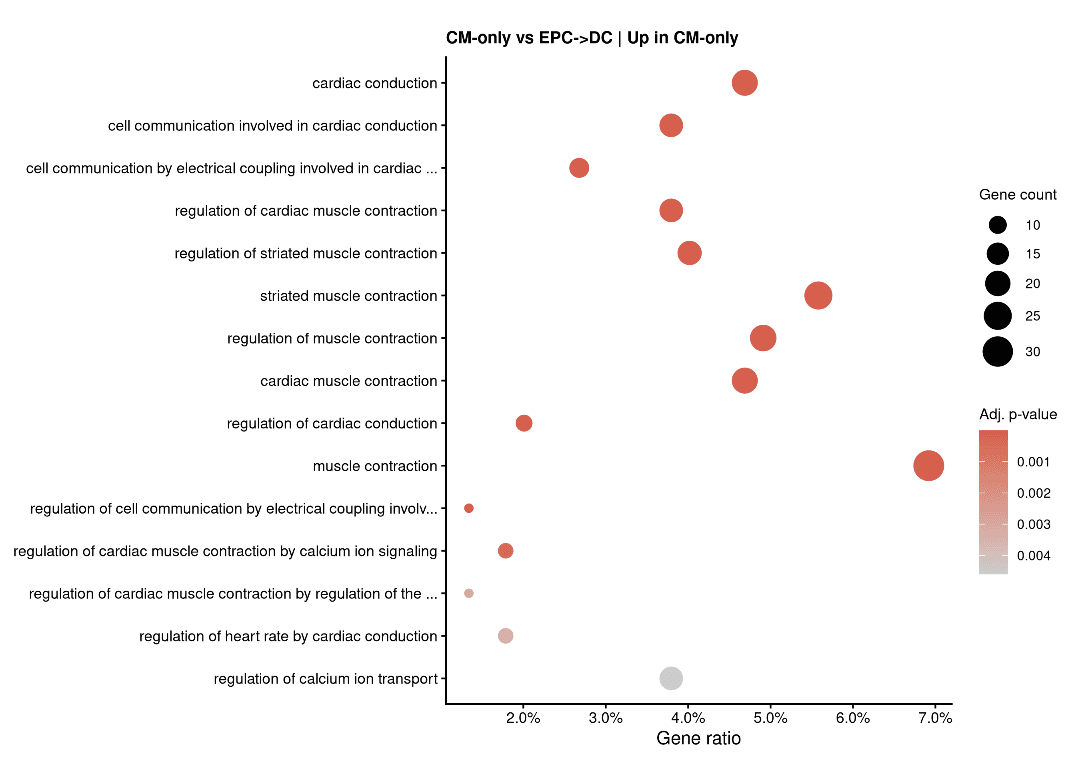
电化学成熟与传导
“心脏传导”是区分 CM-only 与 EPC→DC 的最显著 GO 术语
心脏传导热图显示在 CM-only 和 EPC+SB 中高表达,但在 EPC→DC 中下降。
基因 | log2FC | 校正后 p 值 | % EPC→DC | % EPC(+SB) |
|---|---|---|---|---|
NPPB | 4.19 | <0.001 | 82.9% | 9.9% |
PRRX1 | 3.91 | <0.001 | 29.7% | 1.6% |
KRT80 | 3.82 | <0.001 | 21.9% | 0.9% |
ANKRD1 | 3.50 | <0.001 | 83.0% | 20.0% |
SULT1E1 | 3.19 | <0.001 | 34.3% | 4.3% |
PDLIM3 | 3.06 | <0.001 | 58.6% | 7.6% |
表:上调前 10 个基因 - EPC→DC vs EPC(+SB)
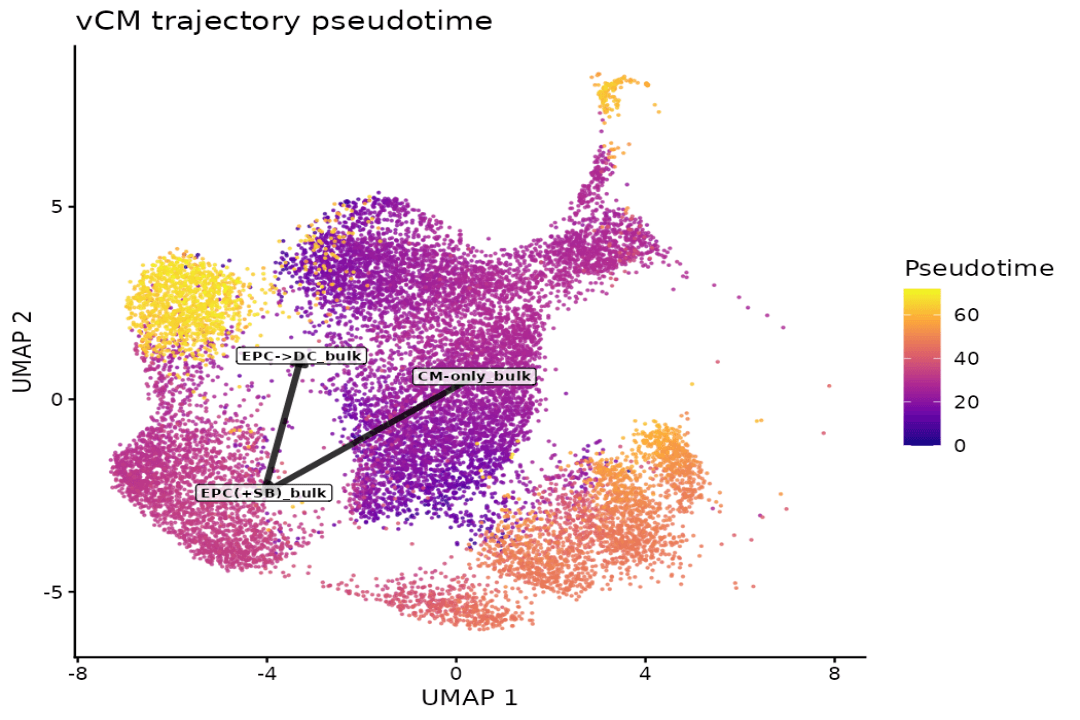
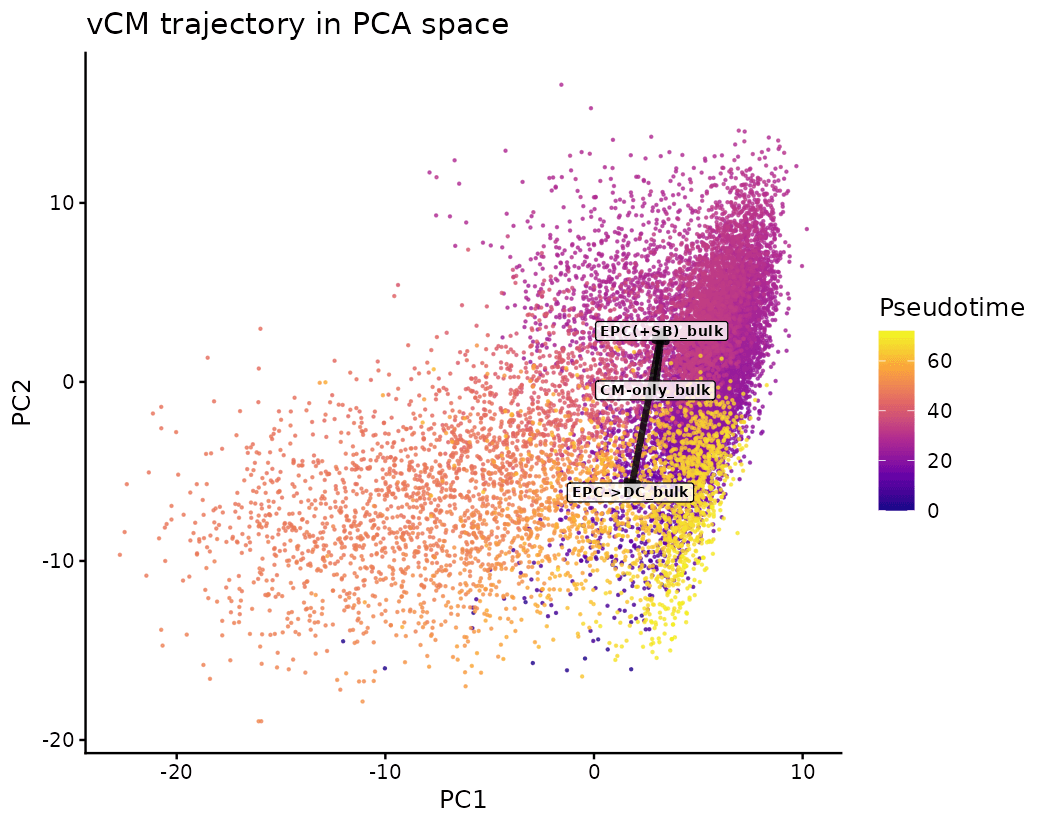
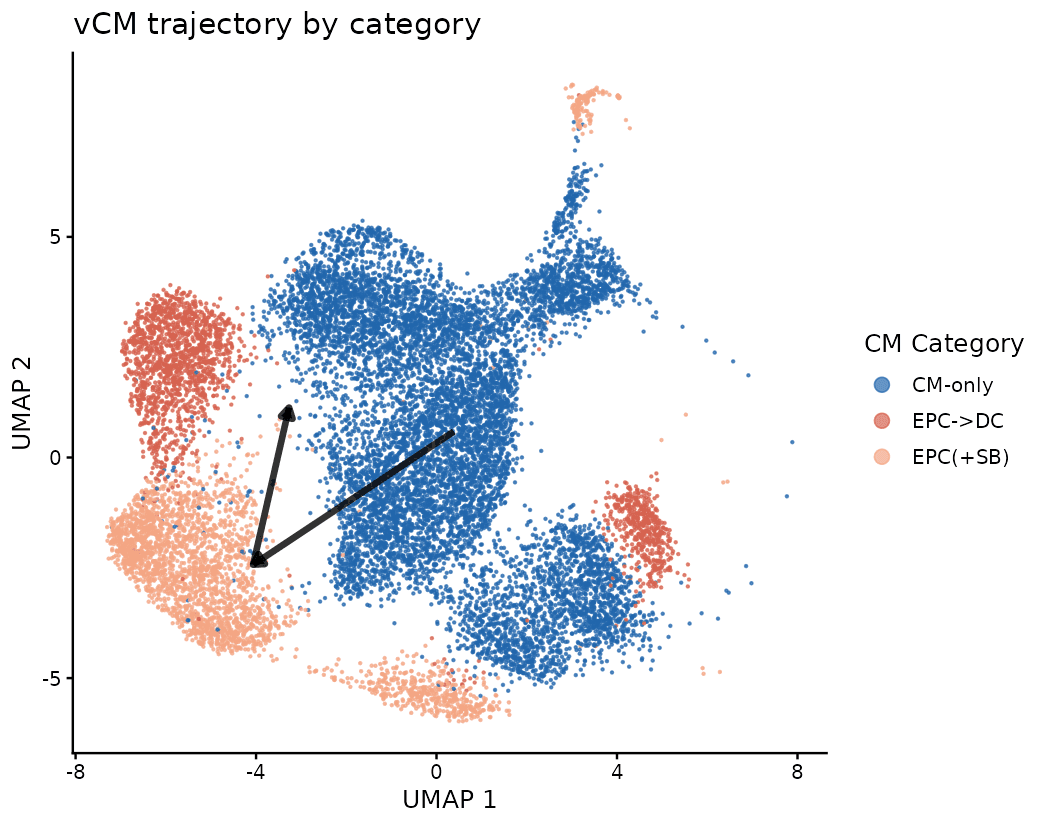
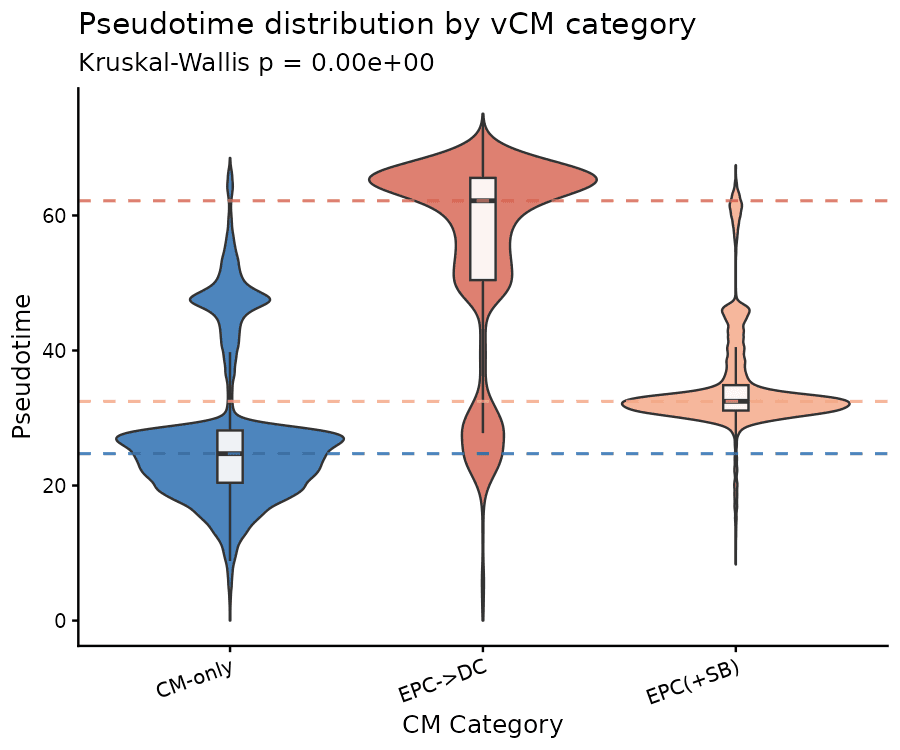
重塑的伪时间推断
Drylab 为每个细胞分配一个连续的“年龄”。EPC→DC 细胞的伪时间显著更晚(中位数 62.2),而 CM-only 为 24.7。
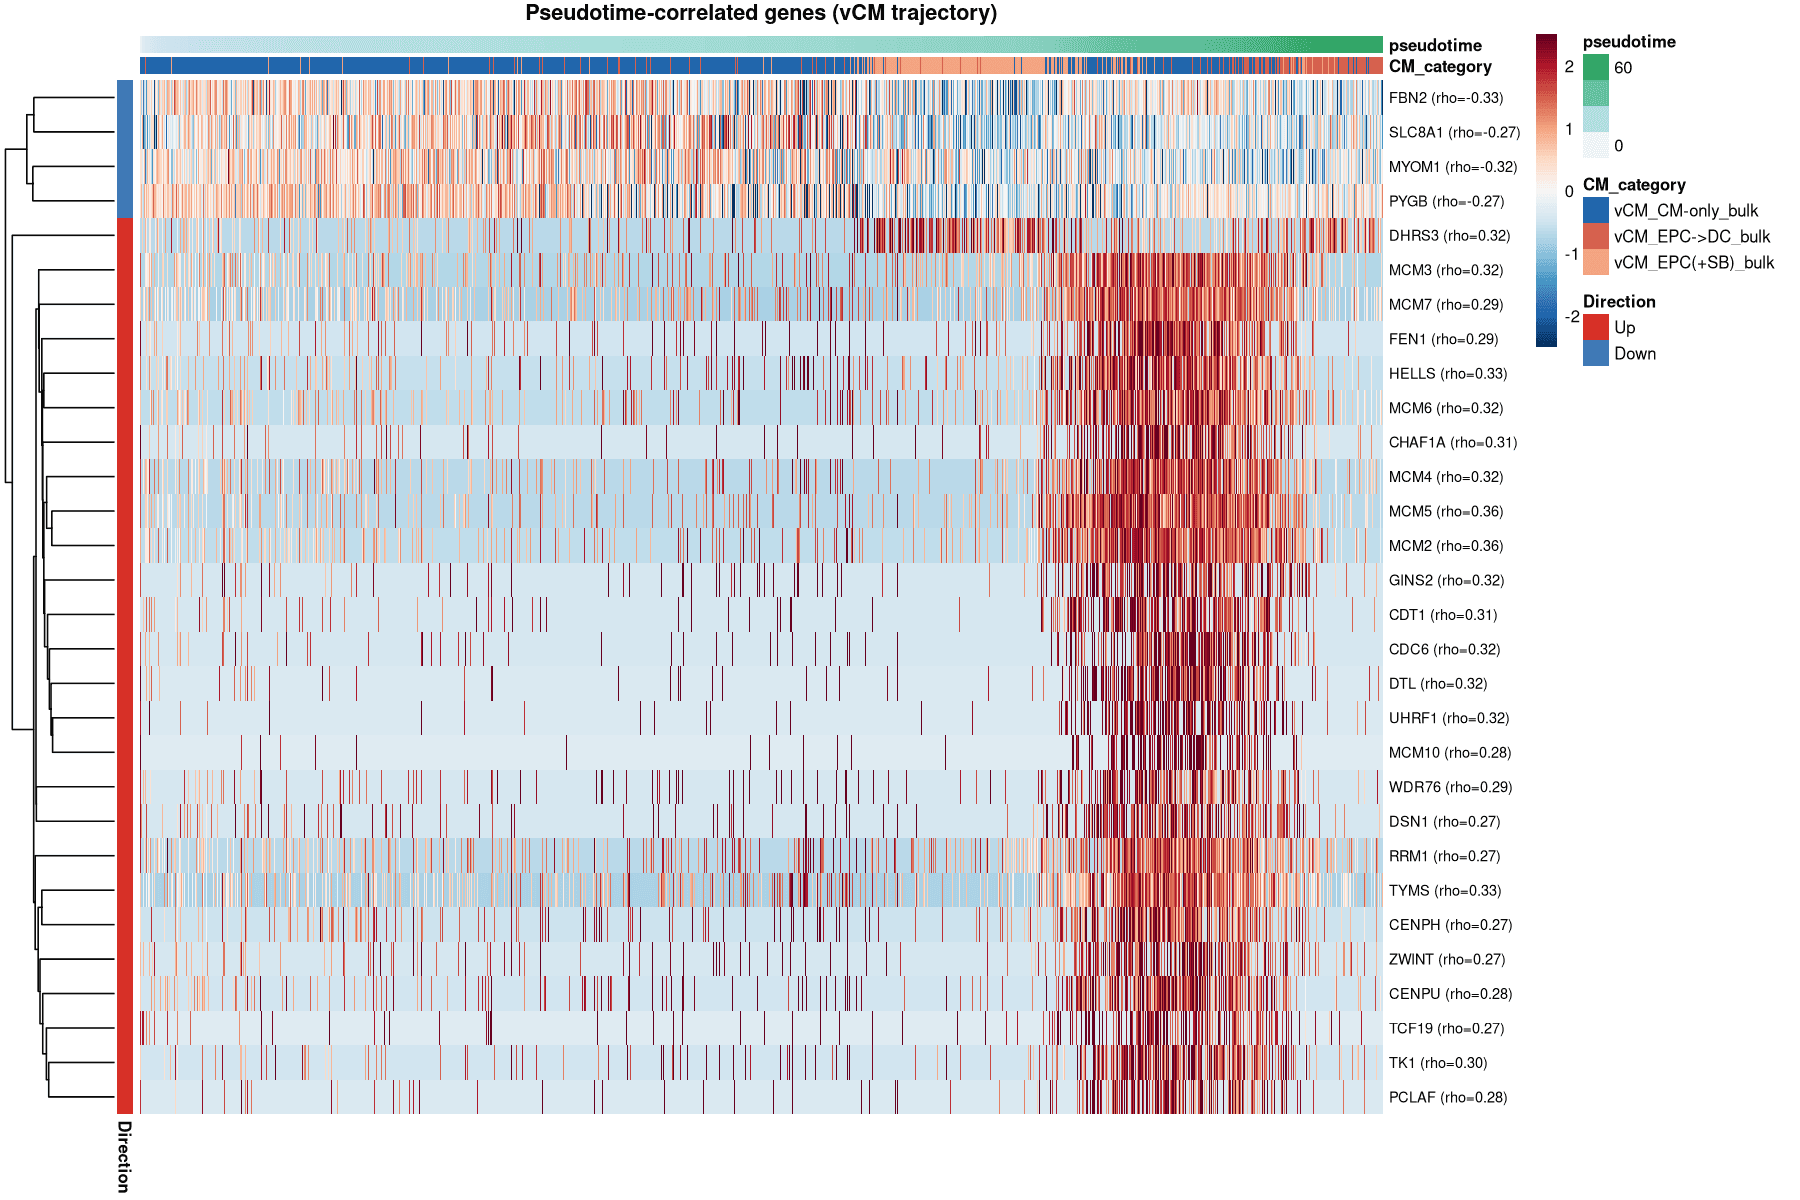
增殖性重塑特征
驱动“成熟”轨迹的主导基因实际上是 DNA 复制因子(MCM2/4/5/6、TYMS、HELLS)。
这表明 EPC→DC 状态并不只是“成熟”,而是一种增殖性重塑状态,在该状态中肌节组装与细胞周期活性同时发生。
增殖性重塑特征
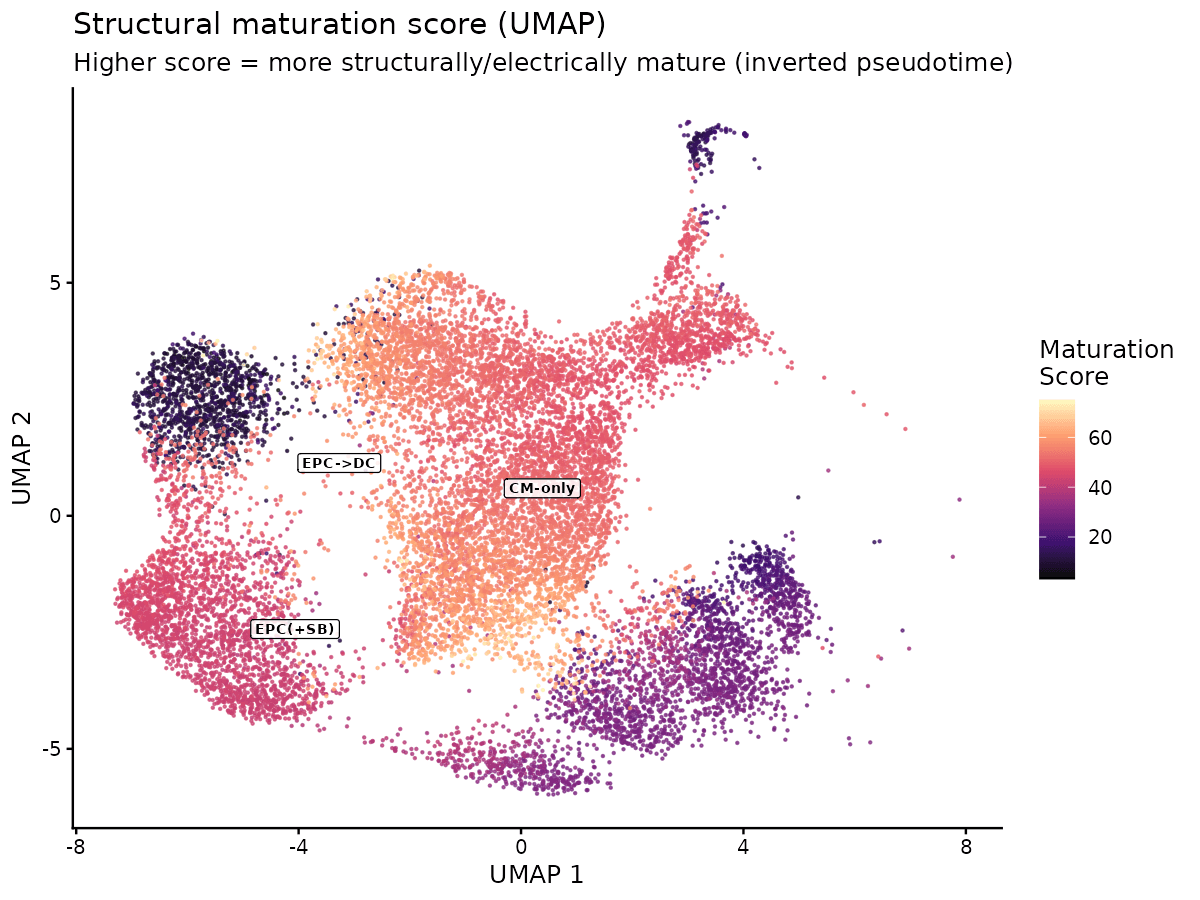
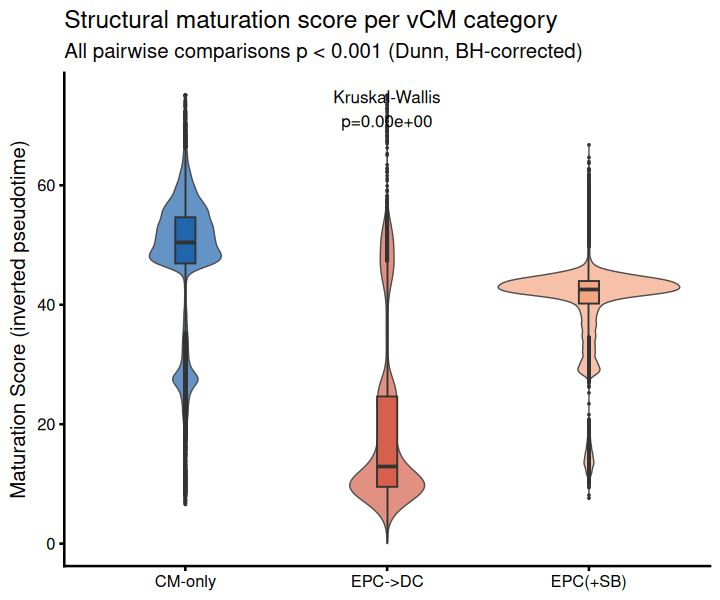
基于经典心肌细胞成熟标记(肌节基因、离子通道、钙处理蛋白)计算了一个综合成熟评分,用于提供每个细胞成熟状态的汇总读数。
EPC->DC 细胞在结构上最不成熟,富集于由具有 TGF-beta 活性的心外膜信号驱动的增殖性、去分化心肌细胞。EPC(+SB) 部分抑制该增殖程序并维持中等结构成熟度。CM-only 细胞是结构/电学成熟度最高的基线状态。