This use case was co-created by academic researchers and Drylab. The full chat conversation demonstrates how researchers interact with Drylab to perform analyses, ask questions, and adapt workflows as new insights emerge.
We hope these examples inspire new approaches and possibilities in your own research.
Original paper: Developmental cues from epicardial cells simultaneously promote cardiomyocyte proliferation and electrochemical maturation
Analysis Framework
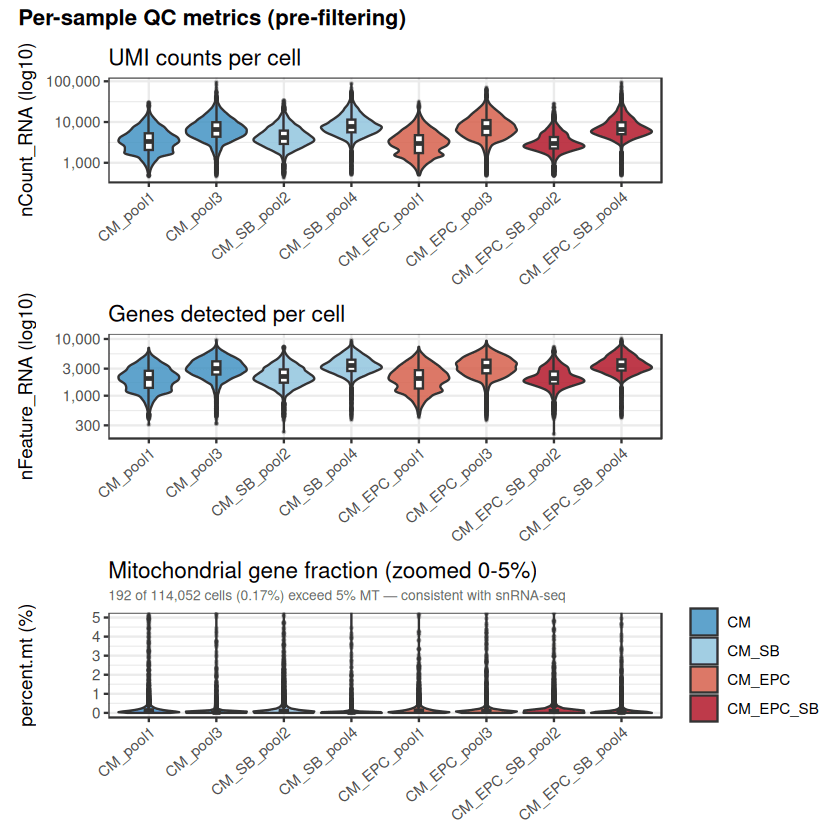
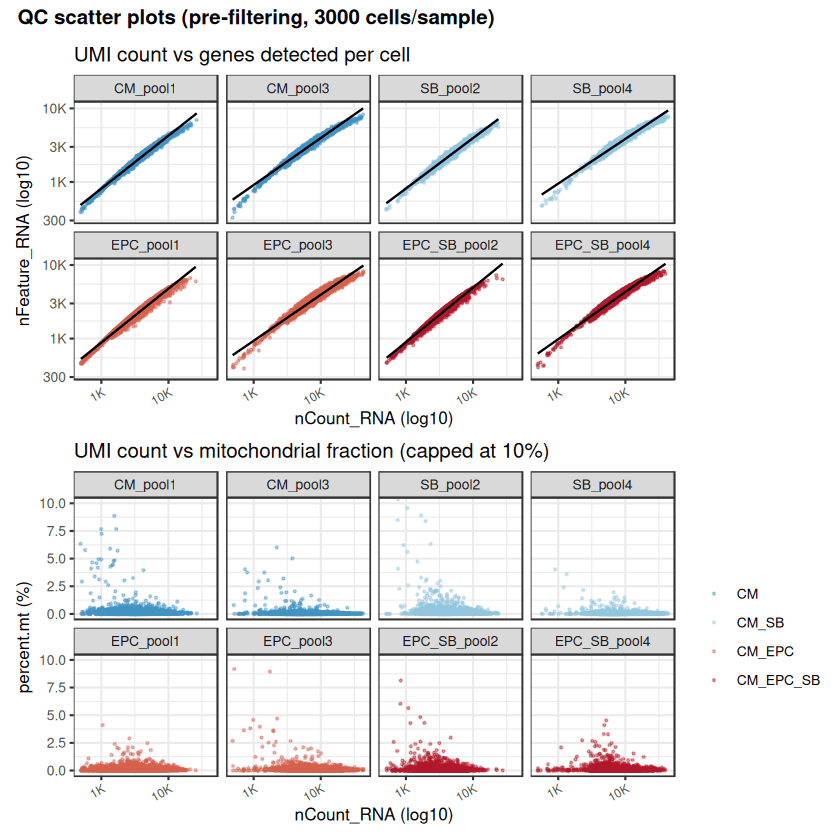
Independent QC filtering (nFeature, percent.mt) confirms the robustness of the deposited GEO dataset (GSE293435).
Drylab analysis achieves high concordance in cell yields across conditions (CM-only, EPC+SB, EPC→DC).
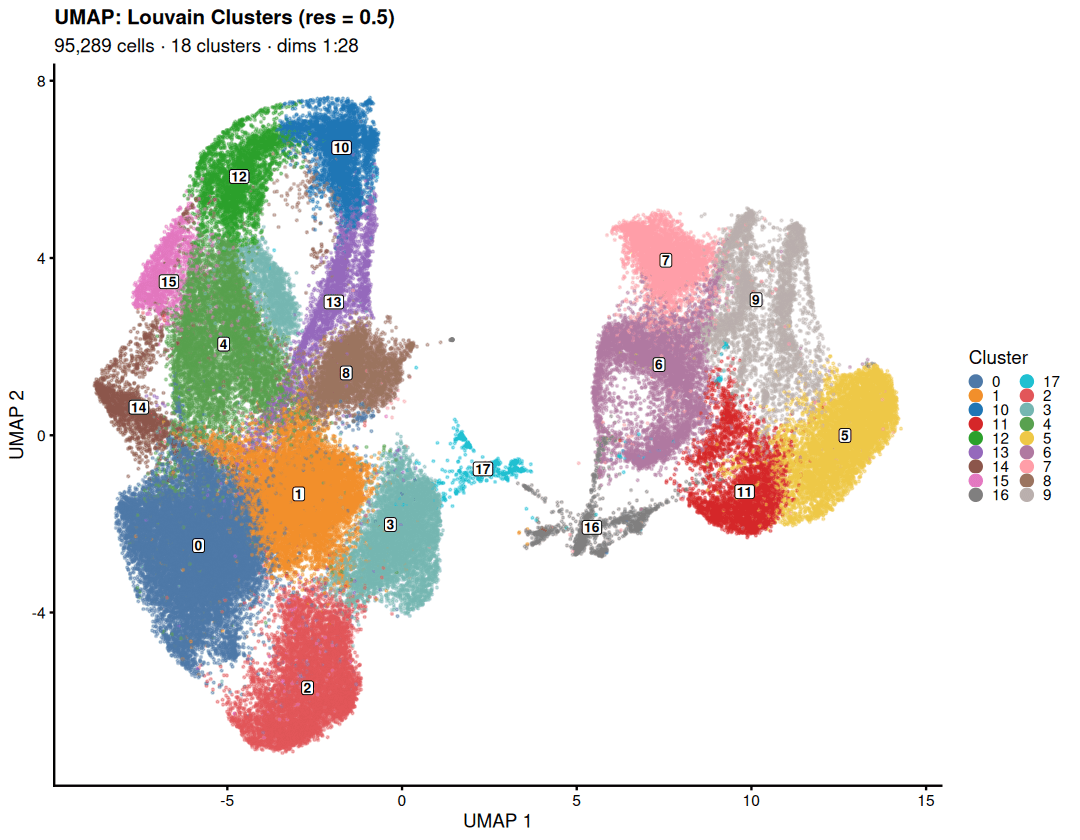
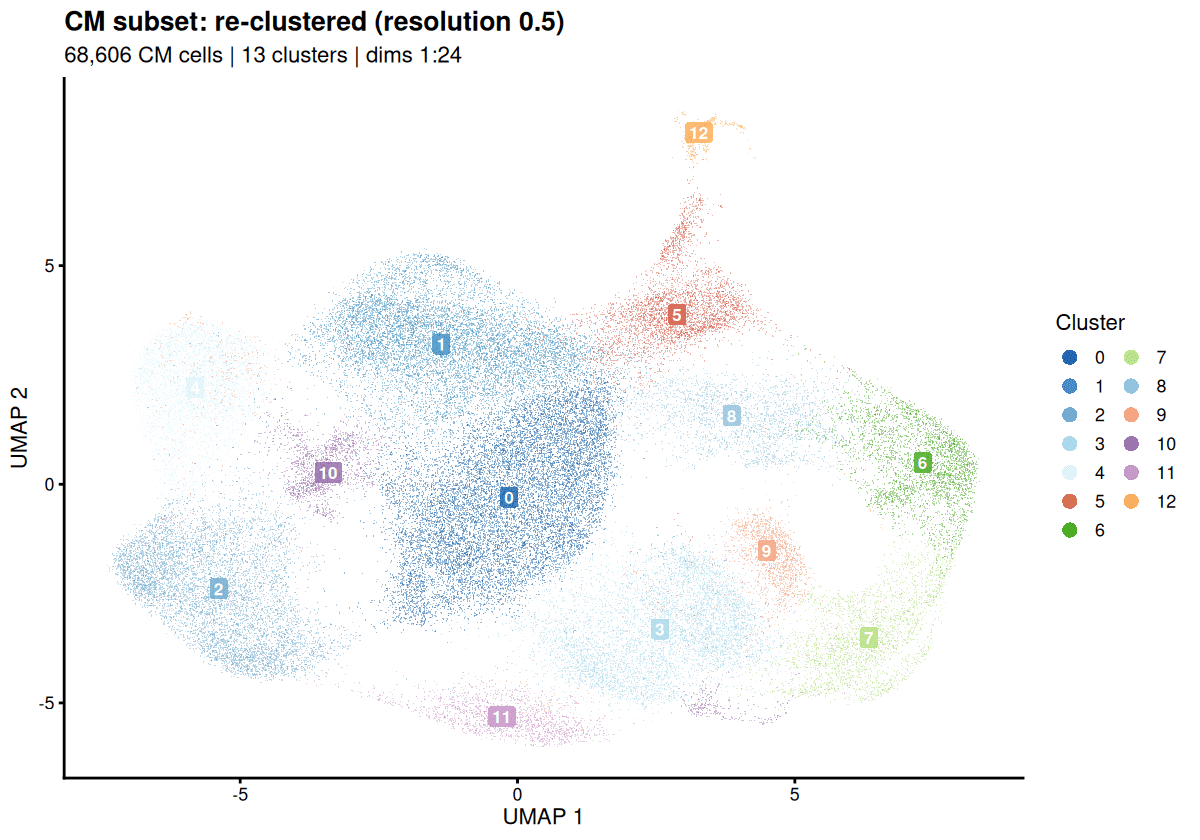
High-Resolution Cell Type Mapping
Drylab’s graph-based clustering perfectly mirrors the paper’s identification of ventricular, atrial, and proliferative CMs.
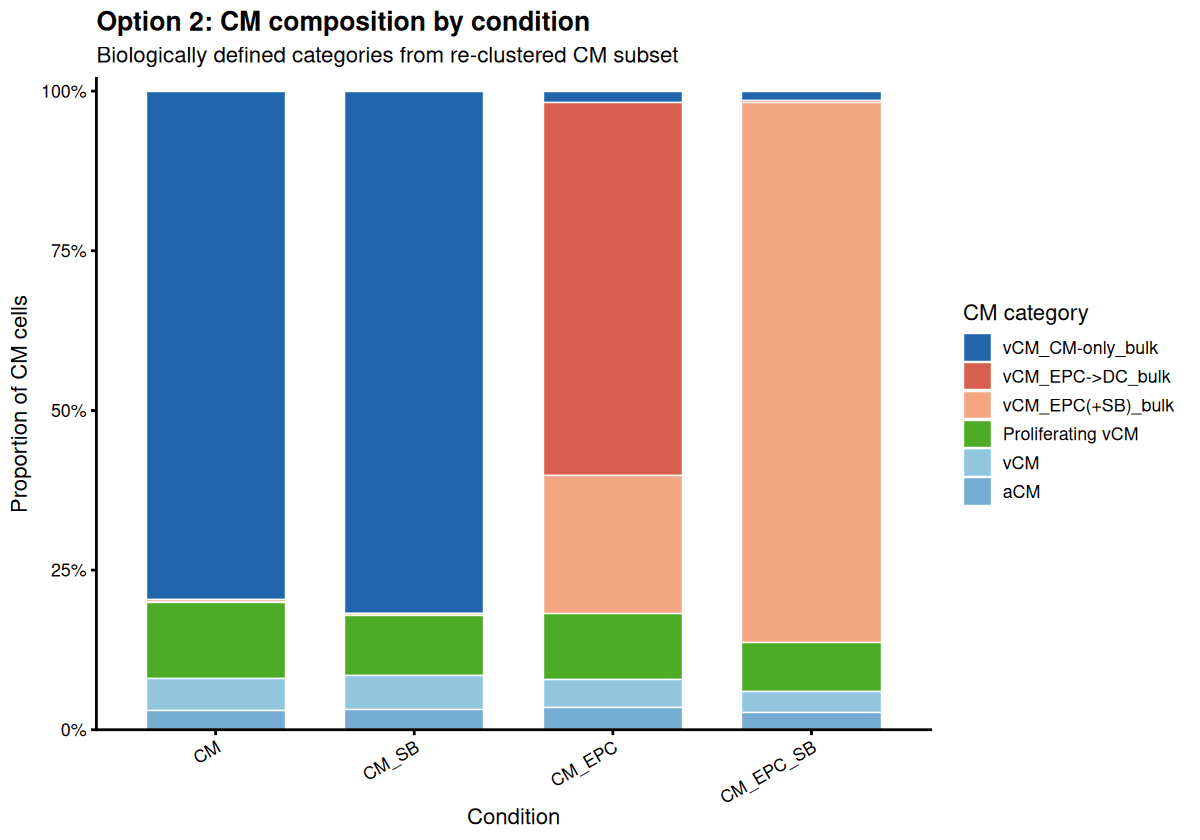
Condition-Specific CM Composition
Confirm that EPC(+SB) co-cultures predominantly produce a unique conduction-competent cluster.
Drylab quantifies that EPC→DC co-culture shifts ~60% of CMs toward a structural remodeling state, validating the paper’s primary phenotype observation.
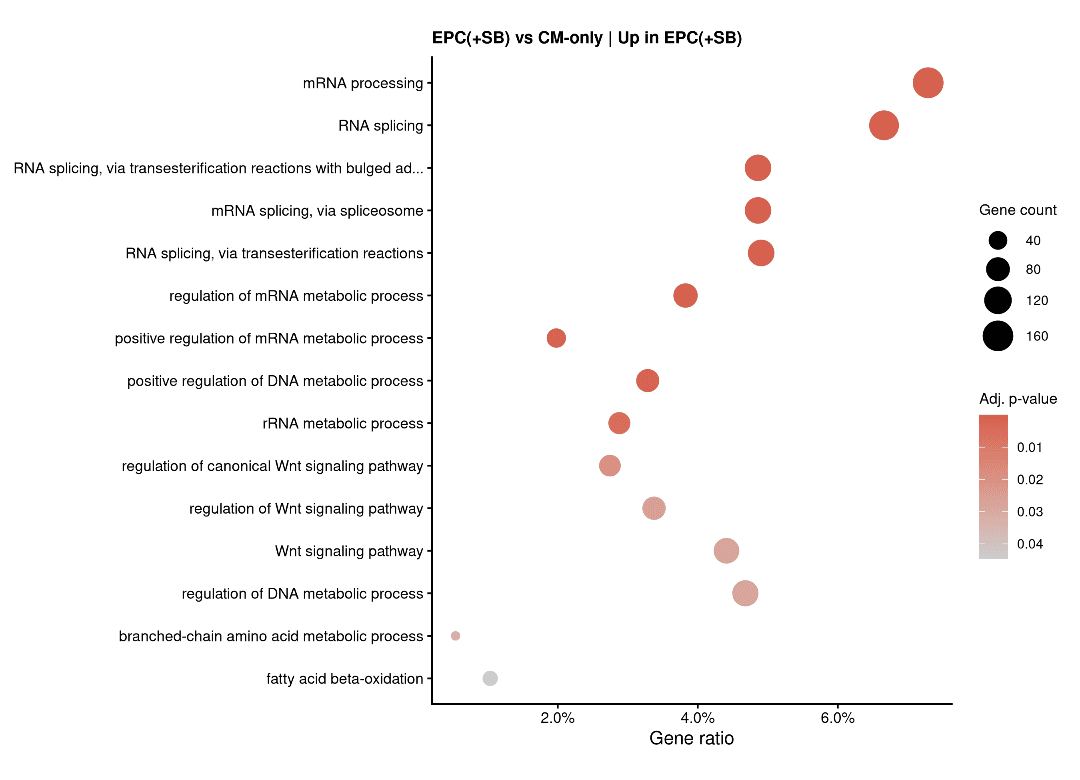
Proliferation vs. Maturation Axis (EPC+SB)
GO analysis confirms the WNT signaling upregulation described in the paper as the driver for proliferation.
Identifies SOX3 and ID3 as the top transcriptional drivers of this proliferative state.
Gene | log2FC | Adj. p-value | % EPC(+SB) | % CM-only |
|---|---|---|---|---|
SOX3 | 3.75 | <0.001 | 15.5% | 1.9% |
CYP26B1 | 3.62 | <0.001 | 11.4% | 1.3% |
ID3 | 3.59 | <0.001 | 29.3% | 4.4% |
NRP2 | 3.31 | <0.001 | 11.7% | 1.6% |
DCN | 3.28 | <0.001 | 28.8% | 4.9% |
PODXL | 3.24 | <0.001 | 10.9% | 1.7% |
Table: Top 10 upregulated genes - EPC(+SB) vs CM-only
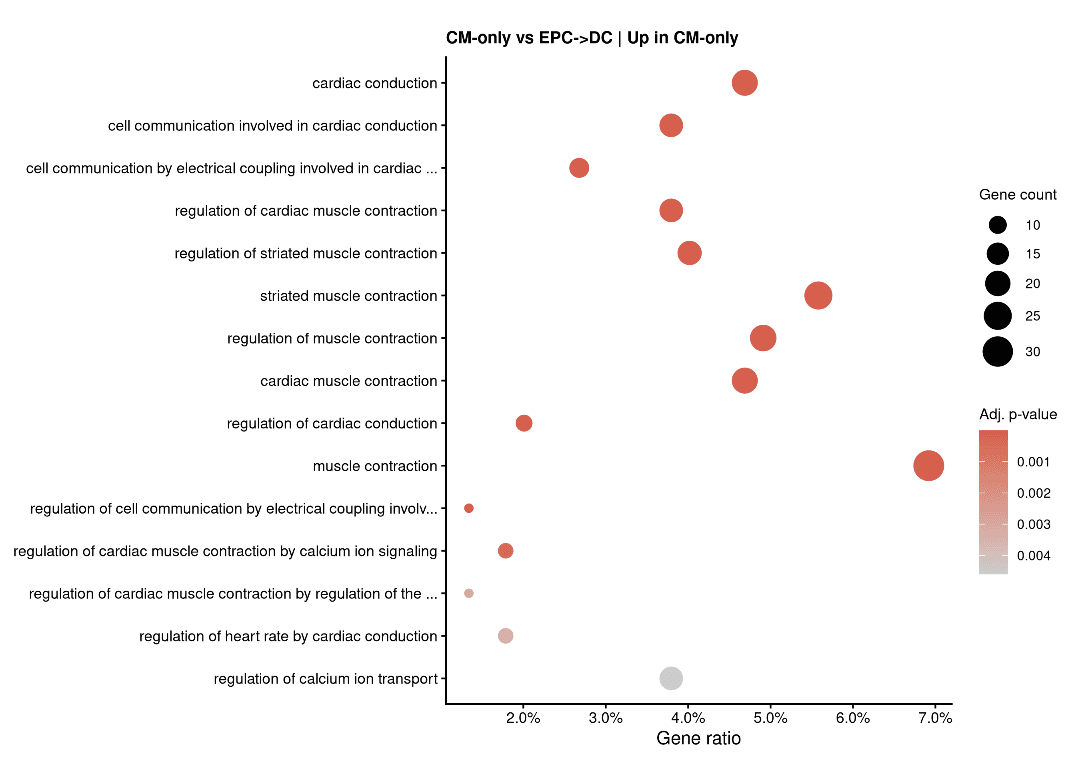
Electrochemical Maturation & Conduction
"Cardiac Conduction" as the most significant GO term differentiating CM-only from EPC→DC
Cardiac Conduction Heatmap showing high expression in CM-only and EPC+SB, but drop-off in EPC→DC.
Gene | log2FC | Adj. p-value | % EPC→DC | % EPC(+SB) |
|---|---|---|---|---|
NPPB | 4.19 | <0.001 | 82.9% | 9.9% |
PRRX1 | 3.91 | <0.001 | 29.7% | 1.6% |
KRT80 | 3.82 | <0.001 | 21.9% | 0.9% |
ANKRD1 | 3.50 | <0.001 | 83.0% | 20.0% |
SULT1E1 | 3.19 | <0.001 | 34.3% | 4.3% |
PDLIM3 | 3.06 | <0.001 | 58.6% | 7.6% |
Table: Top 10 upregulated genes - EPC→DC vs EPC(+SB)
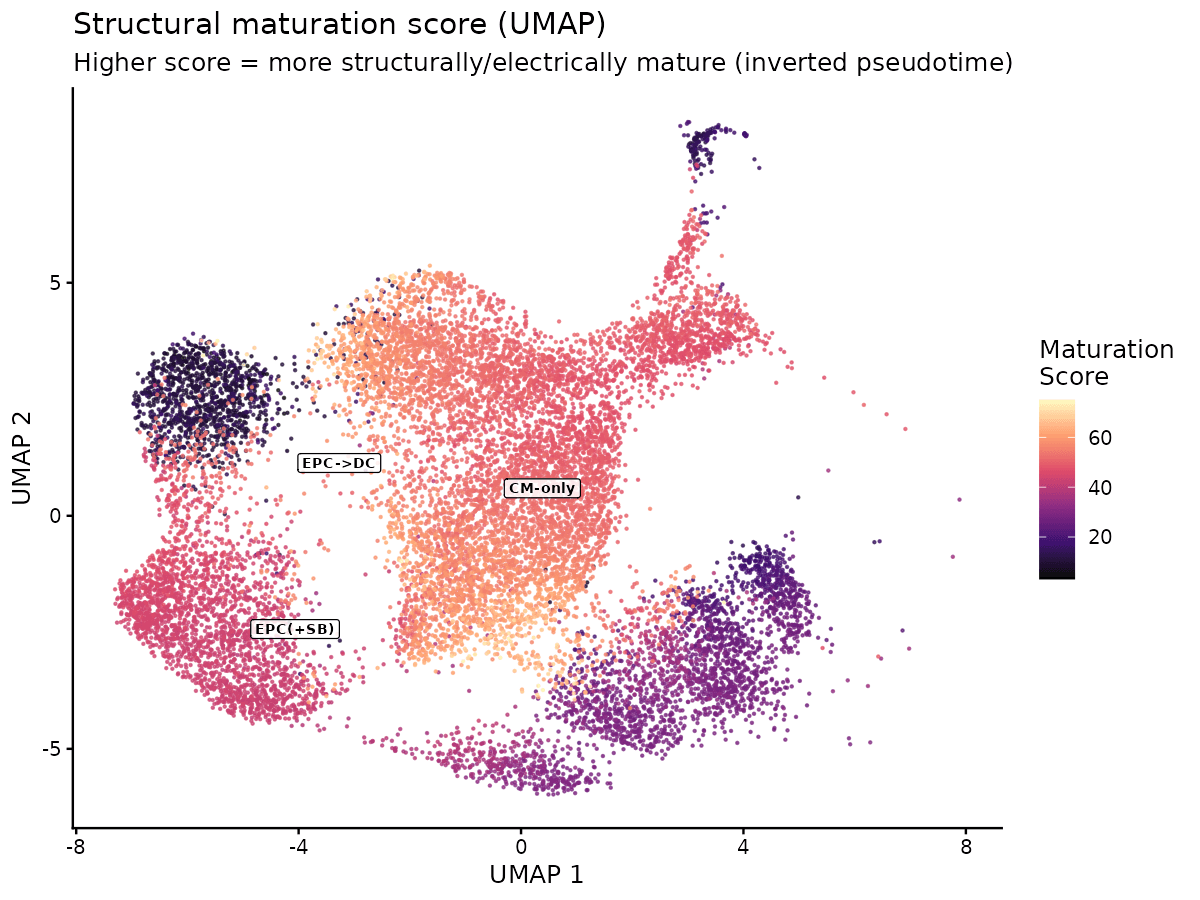
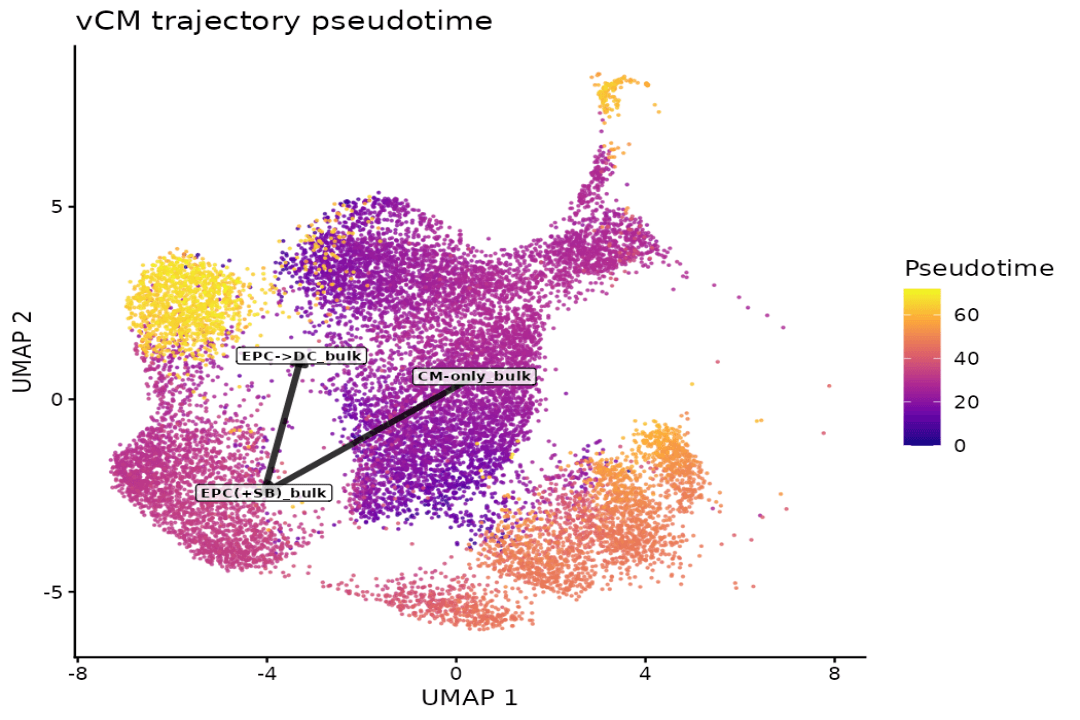
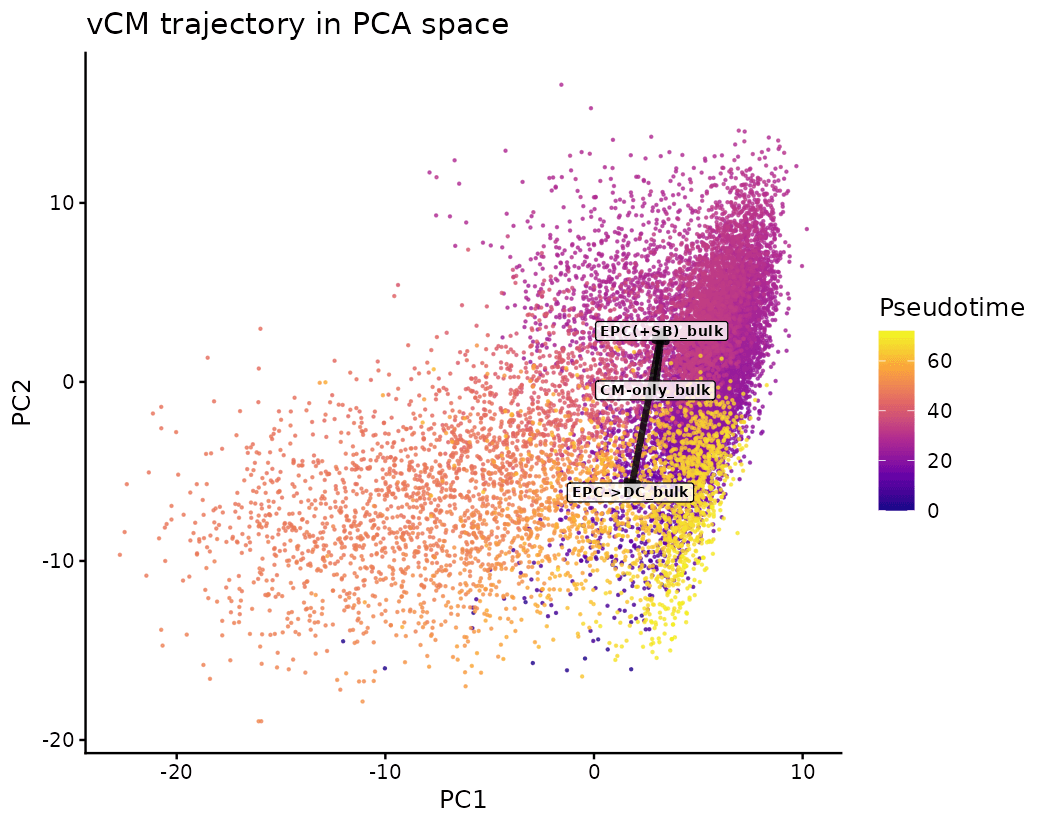
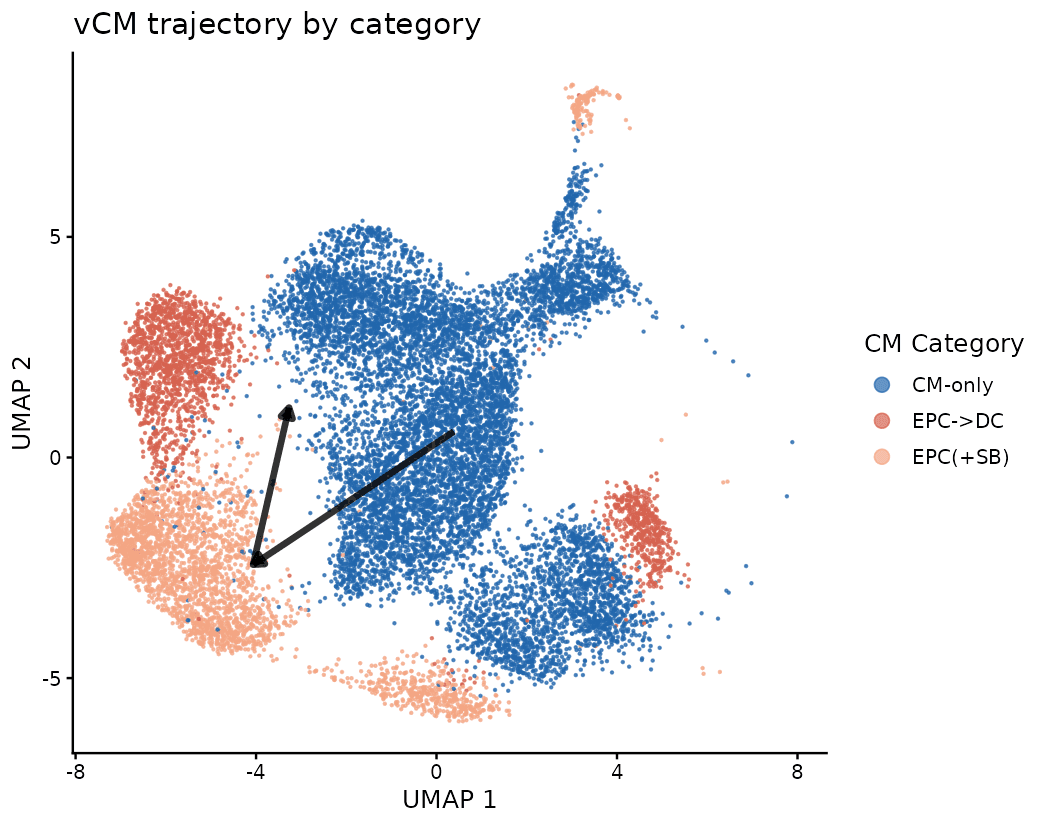
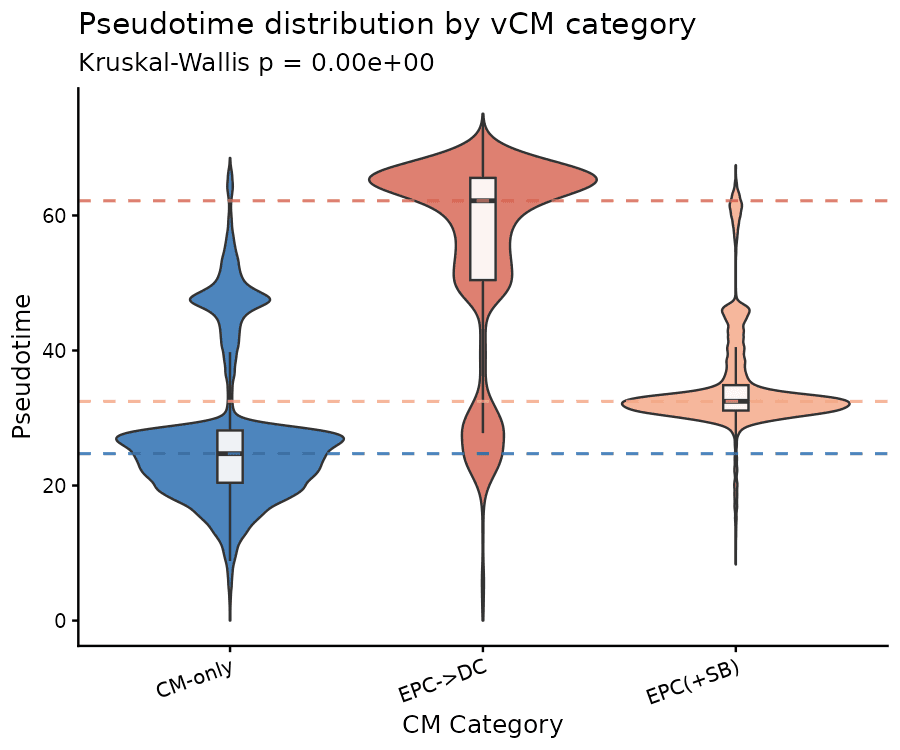
Pseudotime Inference of Remodeling
Drylab assigns a continuous "age" to each cell. EPC→DC cells occupy significantly later pseudotime (median 62.2) than CM-only (24.7).
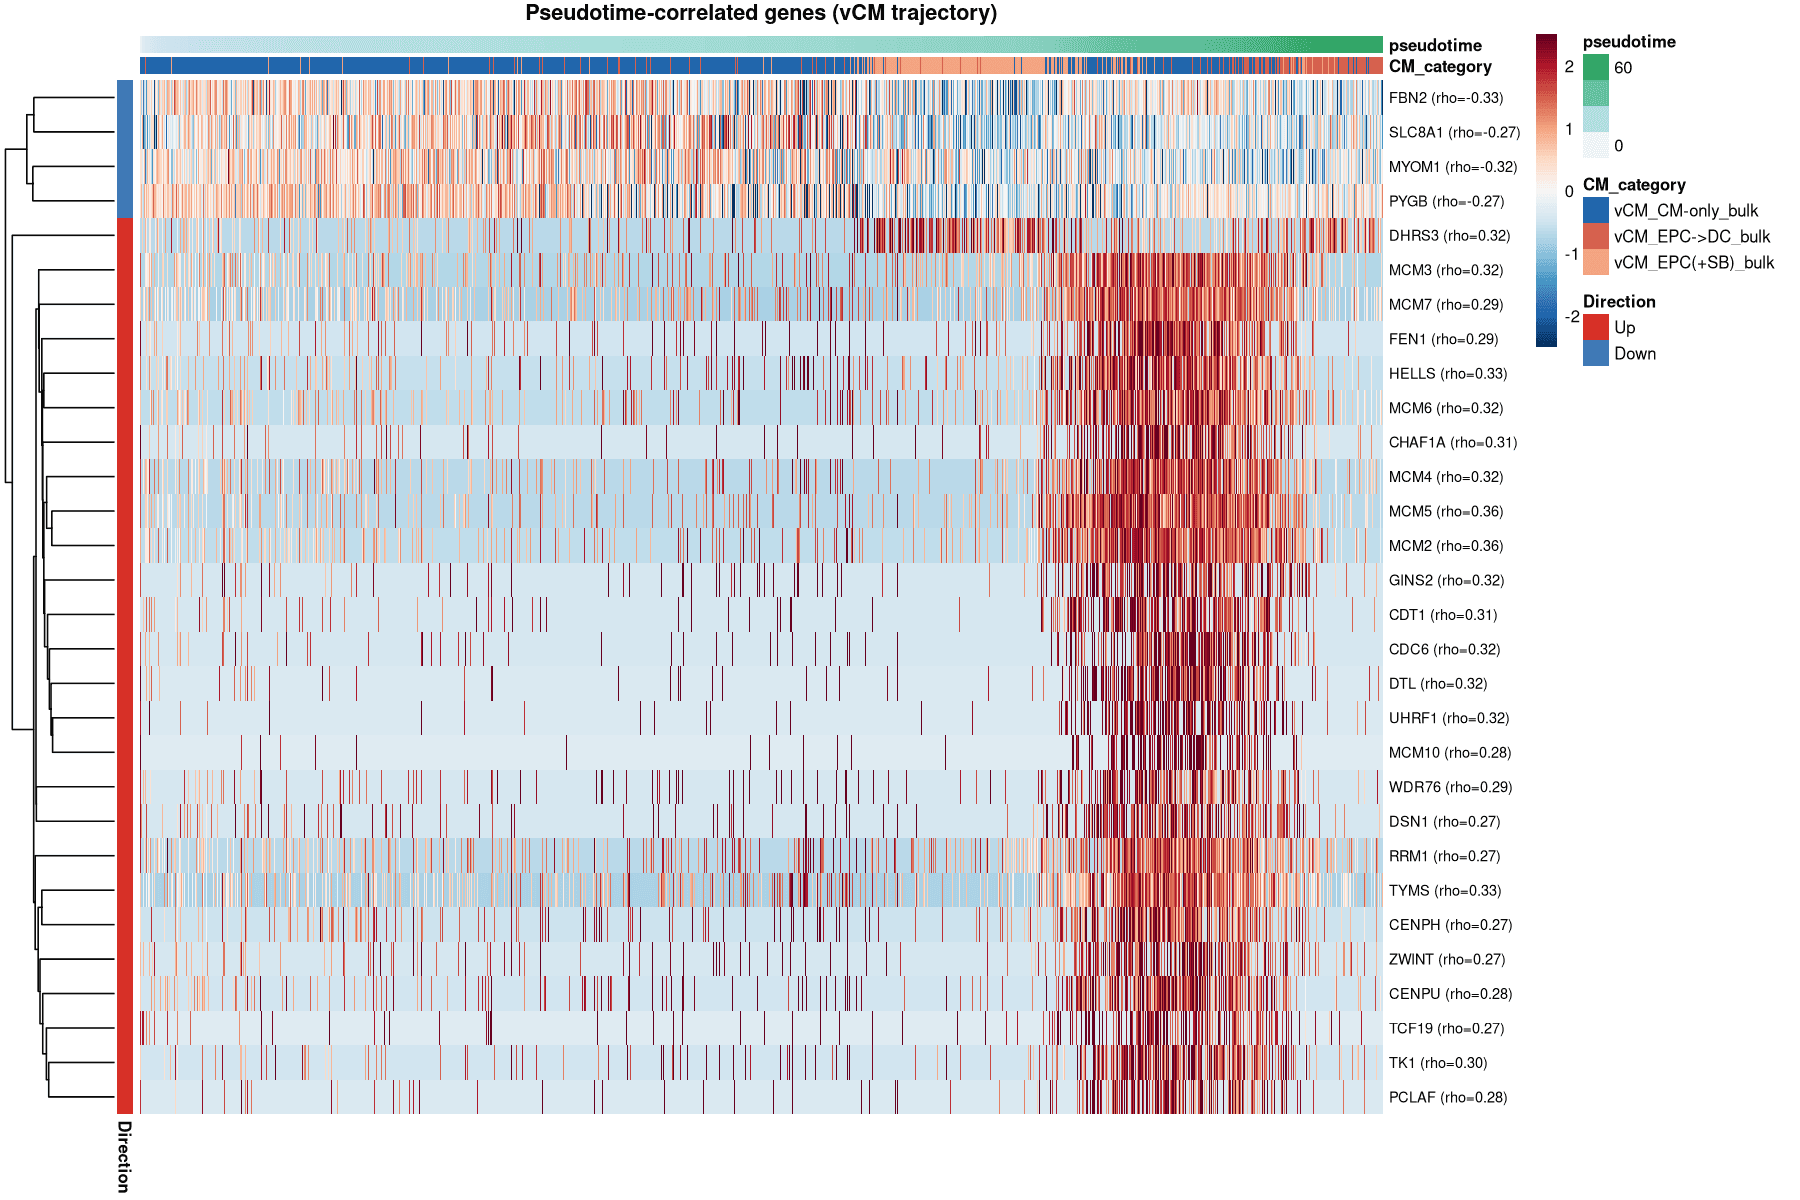
The Proliferative Remodeling Signature
The dominant genes driving the "maturation" trajectory are actually DNA replication factors (MCM2/4/5/6, TYMS, HELLS).
This suggests the EPC→DC state is not just "mature" but is a proliferative remodeling state where sarcomere assembly occurs alongside cell-cycle activity.
The Proliferative Remodeling Signature
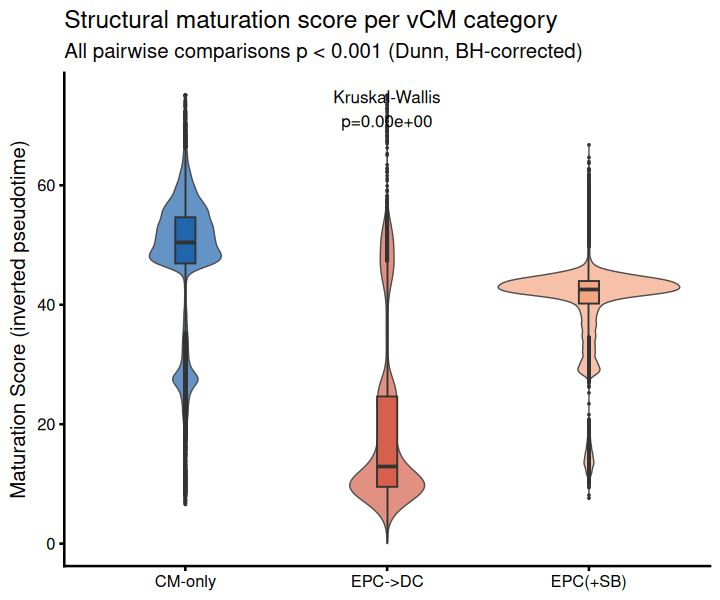
A composite maturation score was computed based on canonical cardiomyocyte maturation markers (sarcomeric genes, ion channels, calcium-handling proteins) to provide a summary readout of each cell’s maturation state.
EPC->DC cells are the least structurally mature, enriched for proliferating, de-differentiated cardiomyocytes driven by TGF-beta-active epicardial signaling. EPC(+SB) partially suppresses this proliferative program and maintains intermediate structural maturity. CM-only cells are the most structurally/electrically mature baseline.