This use case was co-created by academic researchers and Drylab. The full chat conversation demonstrates how researchers interact with Drylab to perform analyses, ask questions, and adapt workflows as new insights emerge.
We hope these examples inspire new approaches and possibilities in your own research.
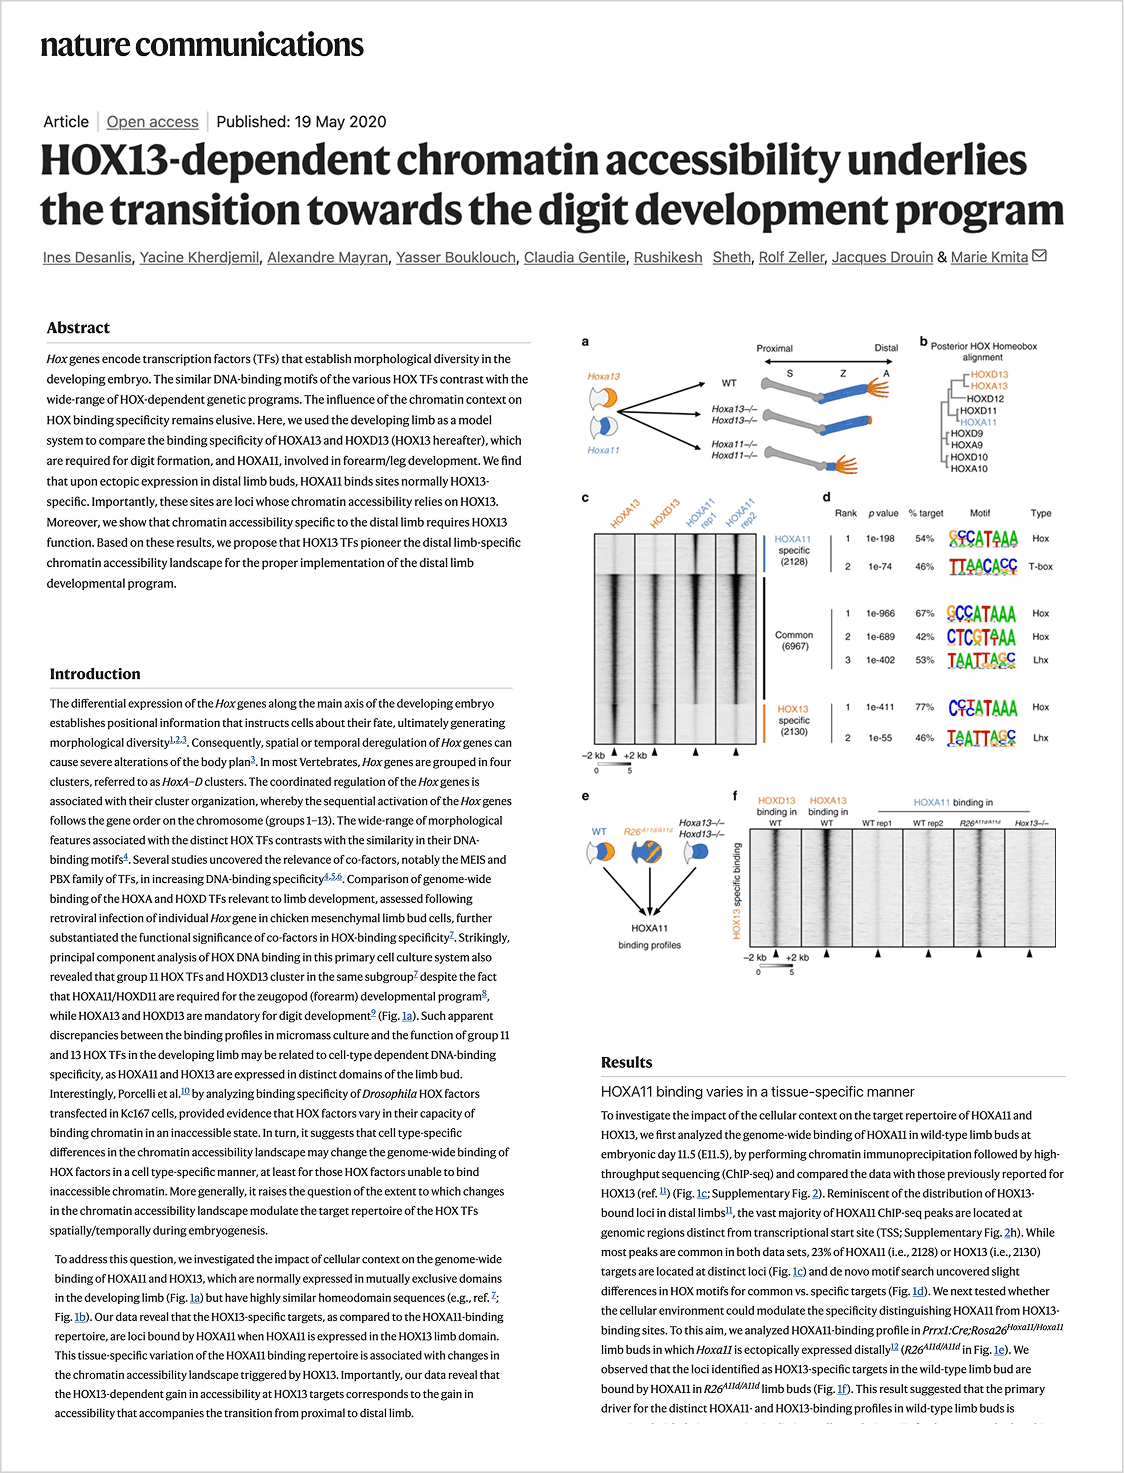
In this use case, we reproduce part of the analysis from the study “HOX13-dependent chromatin accessibility underlies the transition towards the digit development program” (Desanlis et al., 2020, Nature Communications) to demonstrate how Drylab can replicate published computational workflows.
Objective:
The transition from proximal to distal limb identity and the formation of digits require precise chromatin remodeling. HOX13 proteins (HOXA13 and HOXD13) are known to be essential for digit development, but their exact role at the chromatin level remained incompletely understood.
Dataset:
This reanalysis uses the public scATAC-seq dataset GSE145657 (Desanlis et al., Nat Commun (2020)) to provide a comprehensive, reproducible view of HOX13-dependent chromatin accessibility changes in the developing mouse forelimb bud.
QC Filtering:
The standard threshold was selected, retaining 5,581 WT and 3,856 KO cells with median FRIP approximately 0.92, indicating high library quality.
Threshold | Cells retained |
|---|---|
Lenient (log10TN >= 2.5, SE >= 50, FRIP >= 0.60) | 10,072 (76.5%) |
Standard (log10TN >= 3.0, SE >= 100, FRIP >= 0.70) | 9,437 (71.6%) |
Strict (log10TN >= 3.5, SE >= 200, FRIP >= 0.75) | 9,019 (68.5%) |
Dimension reduction:
- Spectral embedding yielded 46 non-trivial components; elbow detection placed the dominant biological signal at component 5.
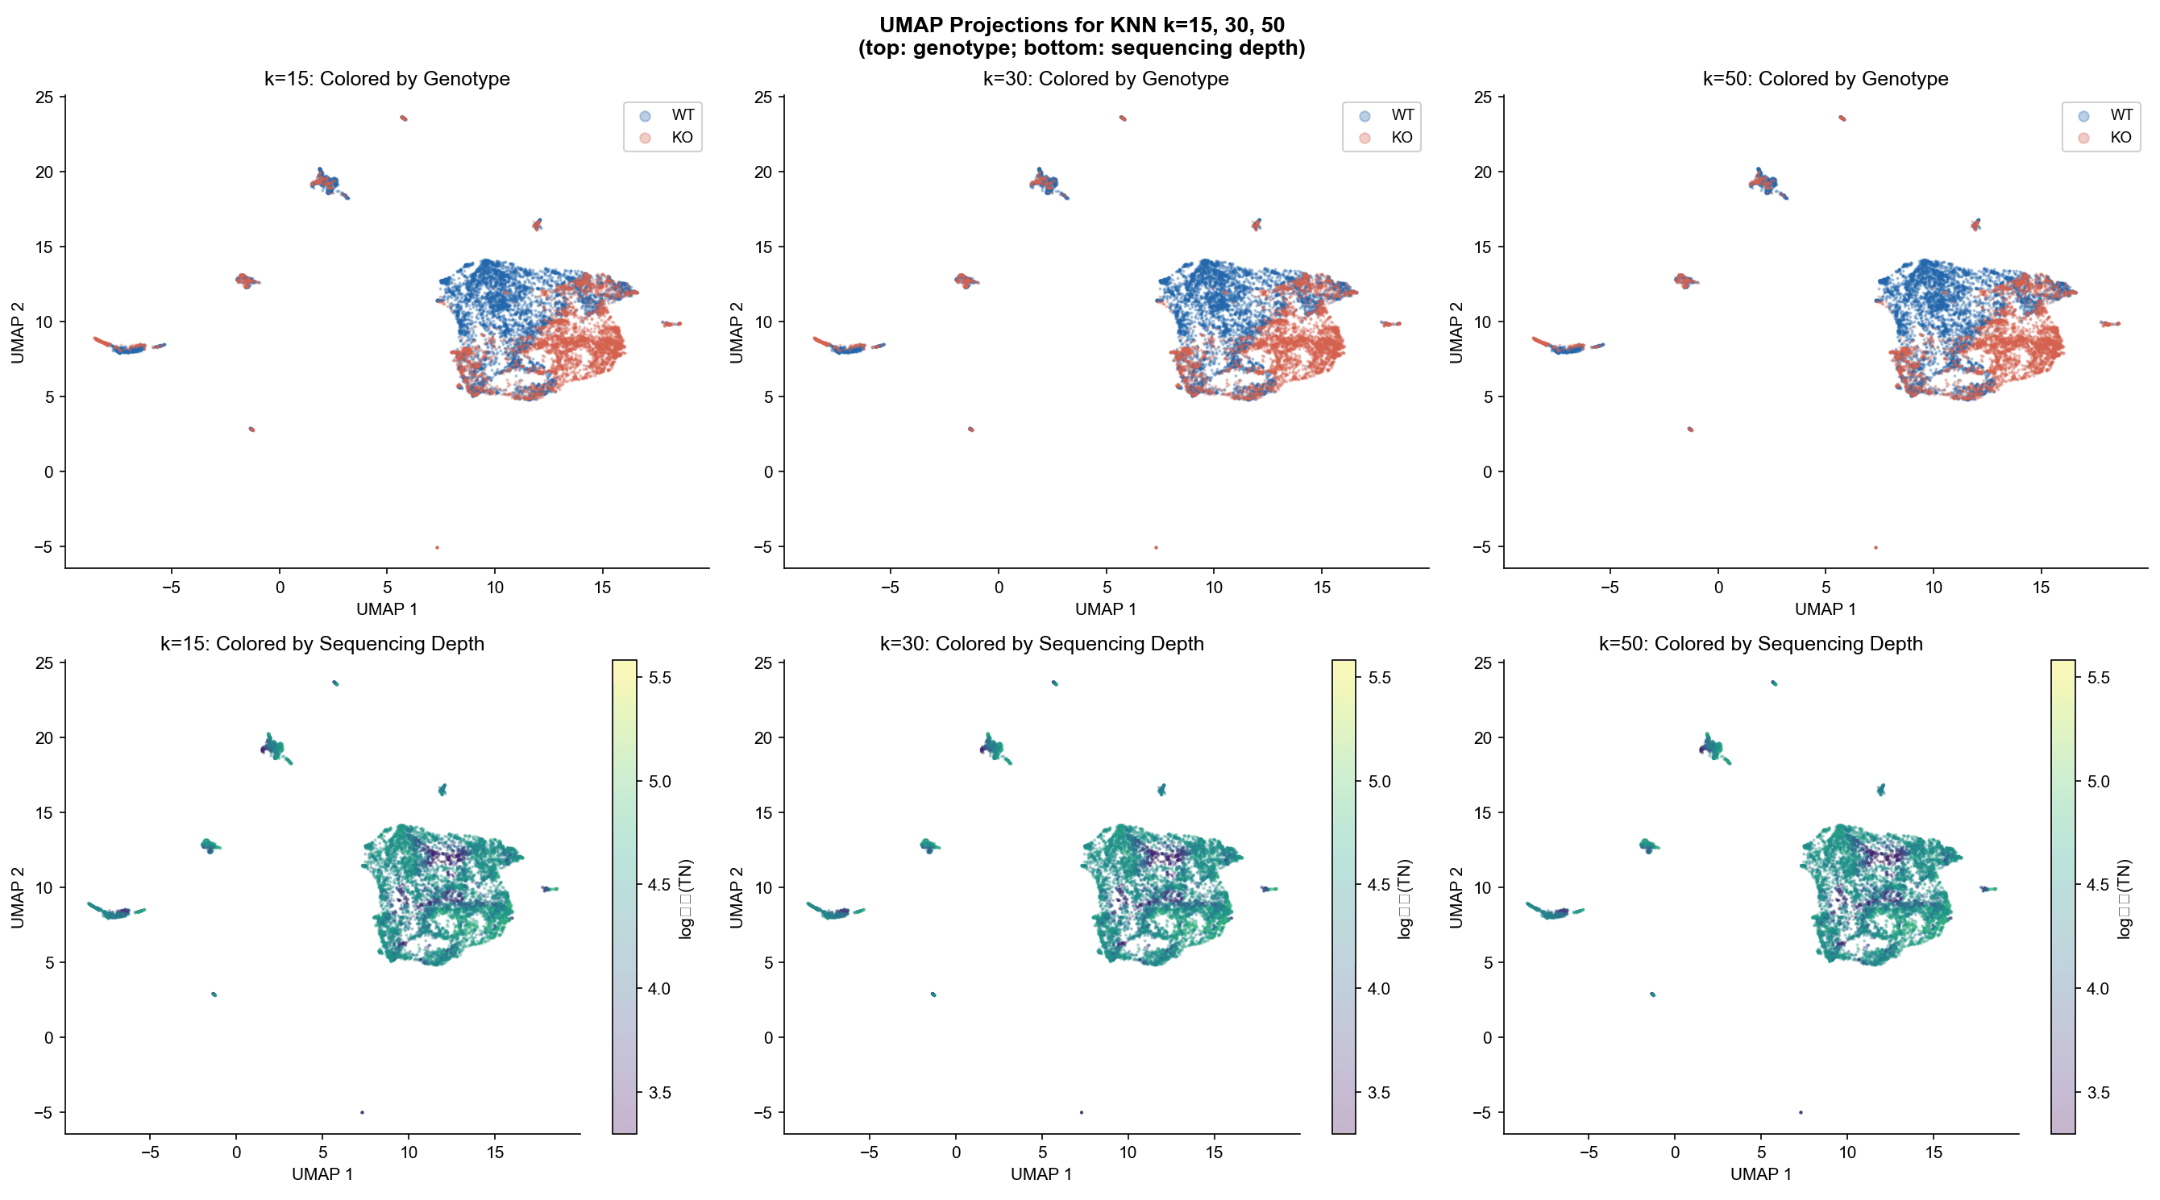
- UMAP topology was stable across k = 15, 30, 50, confirming robustness of the manifold structure.
Parameter set | n_clusters | Silhouette | Subsampling ARI |
|---|---|---|---|
k=15, res=1.0 | 19 | 0.136 | 0.724 +/- 0.059 |
k=30, res=1.0 | 17 | 0.144 | 0.776 +/- 0.042 |
k=50, res=0.6 | 12 | 0.172 | 0.802 +/- 0.074 |
Clustering Stability Grid Search
The optimal parameters (k = 50, resolution = 0.6) achieved the highest silhouette score and subsampling ARI simultaneously, yielding 12 clusters.
Clustering Stability Grid Search
The optimal parameters (k = 50, resolution = 0.6) achieved the highest silhouette score and subsampling ARI simultaneously, yielding 12 clusters.
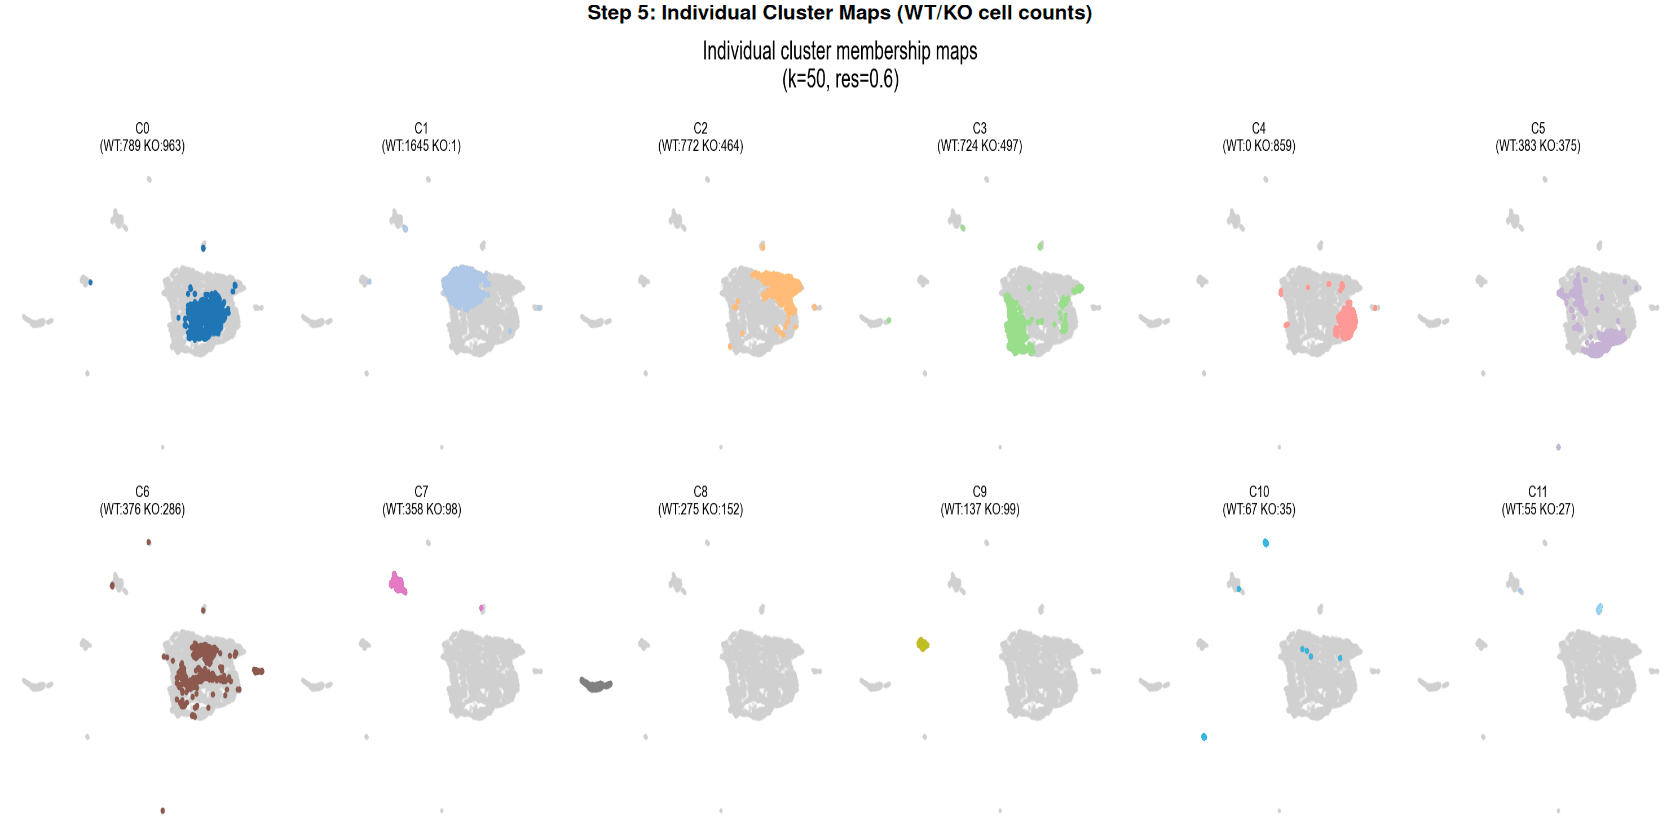
- WT and KO cells occupy largely overlapping regions, with clear genotype-biased sub-populations.
- Sequencing depth is evenly distributed and does not drive the observed separation, confirming biological (not technical) differences.
- The manifold structure is stable, and genotype separation is not an artifact of library quality.
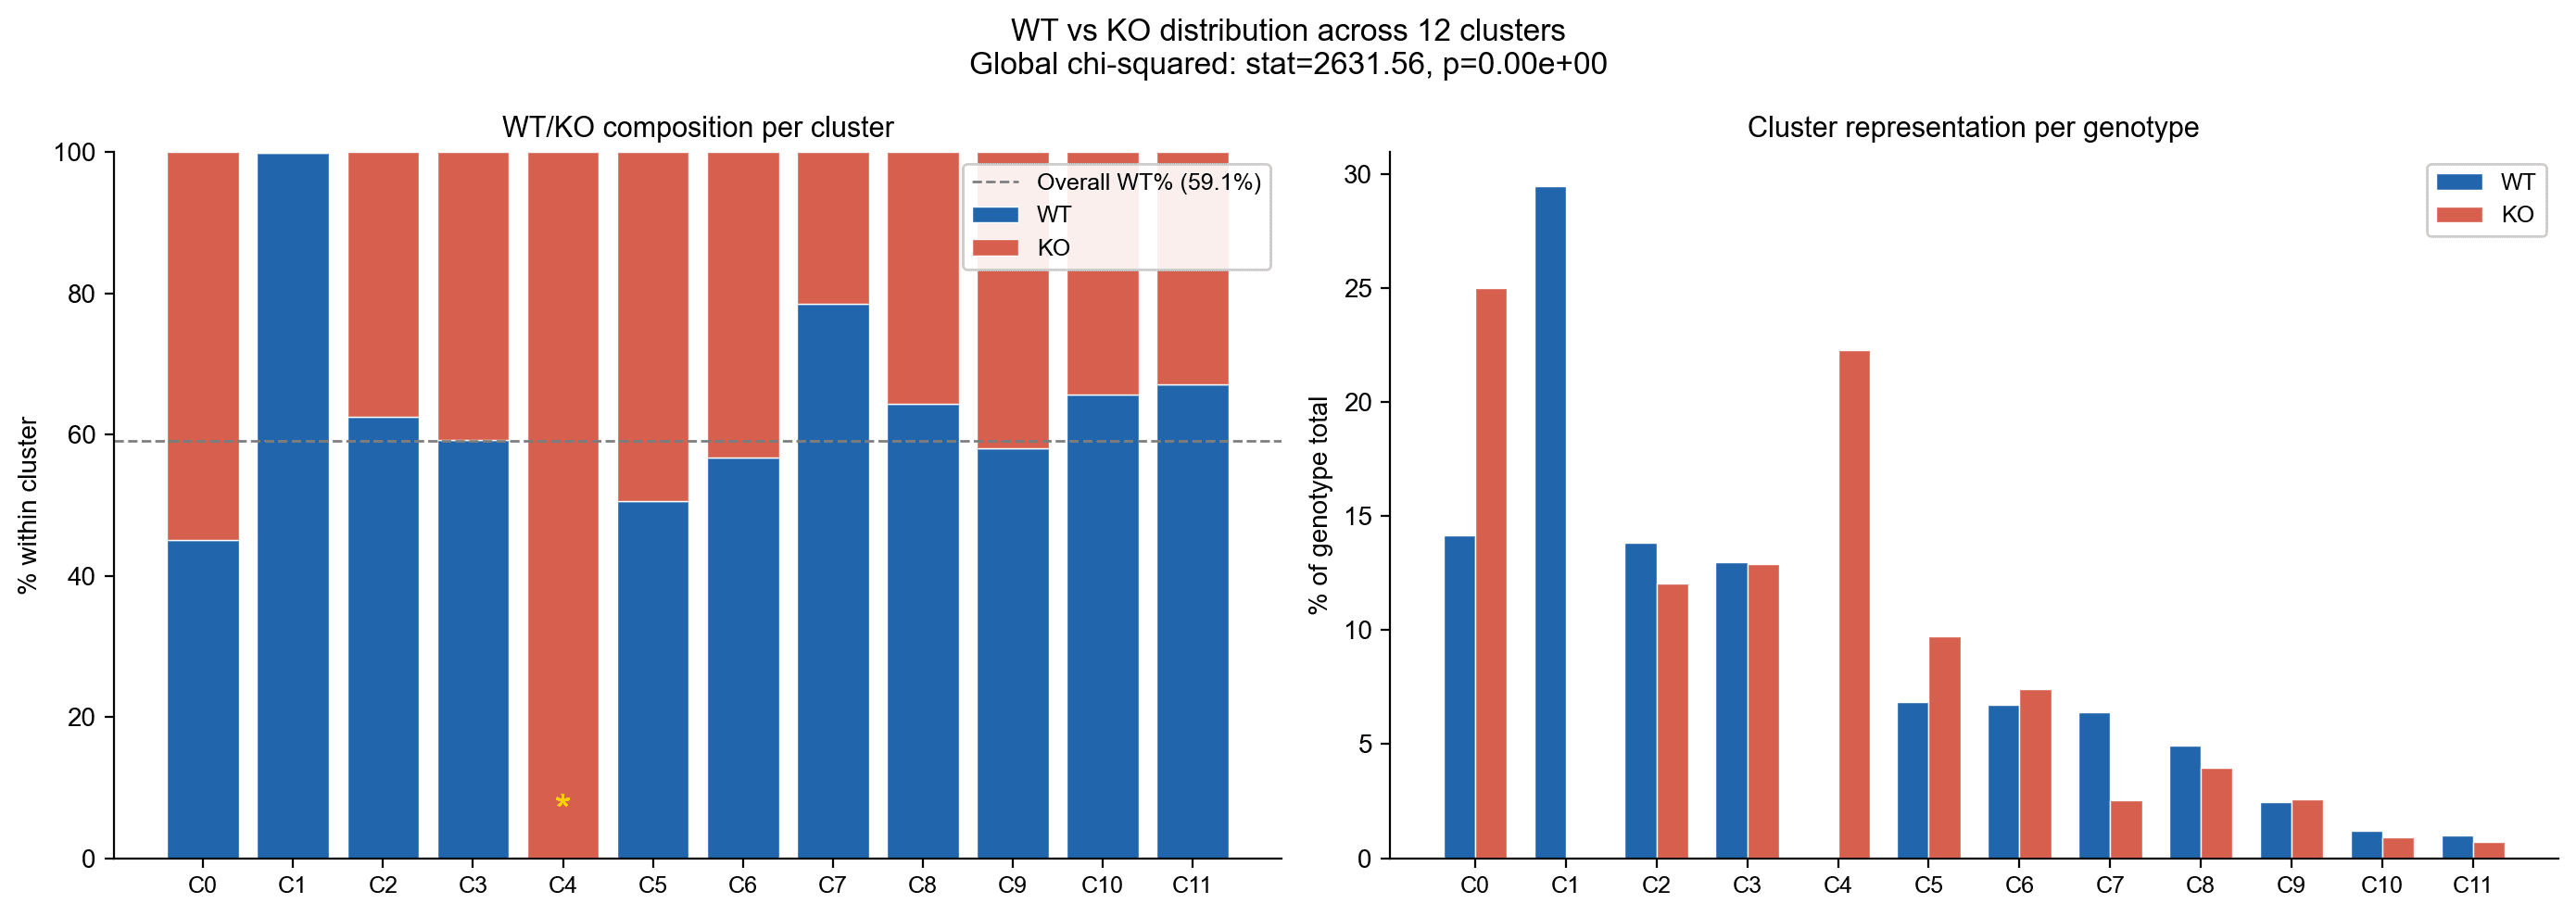
Genotype Distribution Across 12 Clusters
A global χ² test (statistic = 2,631.56, p ≈ 0) showed highly significant association between genotype and cluster.
WT/KO composition per cluster (left) and contribution of each genotype to clusters (right).
- C1 (Digit Mesenchyme): 1,646 cells, 99.9 % WT
- C4 (KO-Aberrant Mesenchyme): 859 cells, 100 % KO
Most other clusters are shared, HOX13 affects only specific cell states.
Statistical Enrichment – Forest Plot
Per-cluster Fisher’s exact test with BH correction and bootstrap 95 % CI.
- C1 is extremely WT-enriched (log2 OR +10.07).
- C4 is completely KO-exclusive (log2 OR −11.64). Gray bars indicate clusters independent of HOX13.
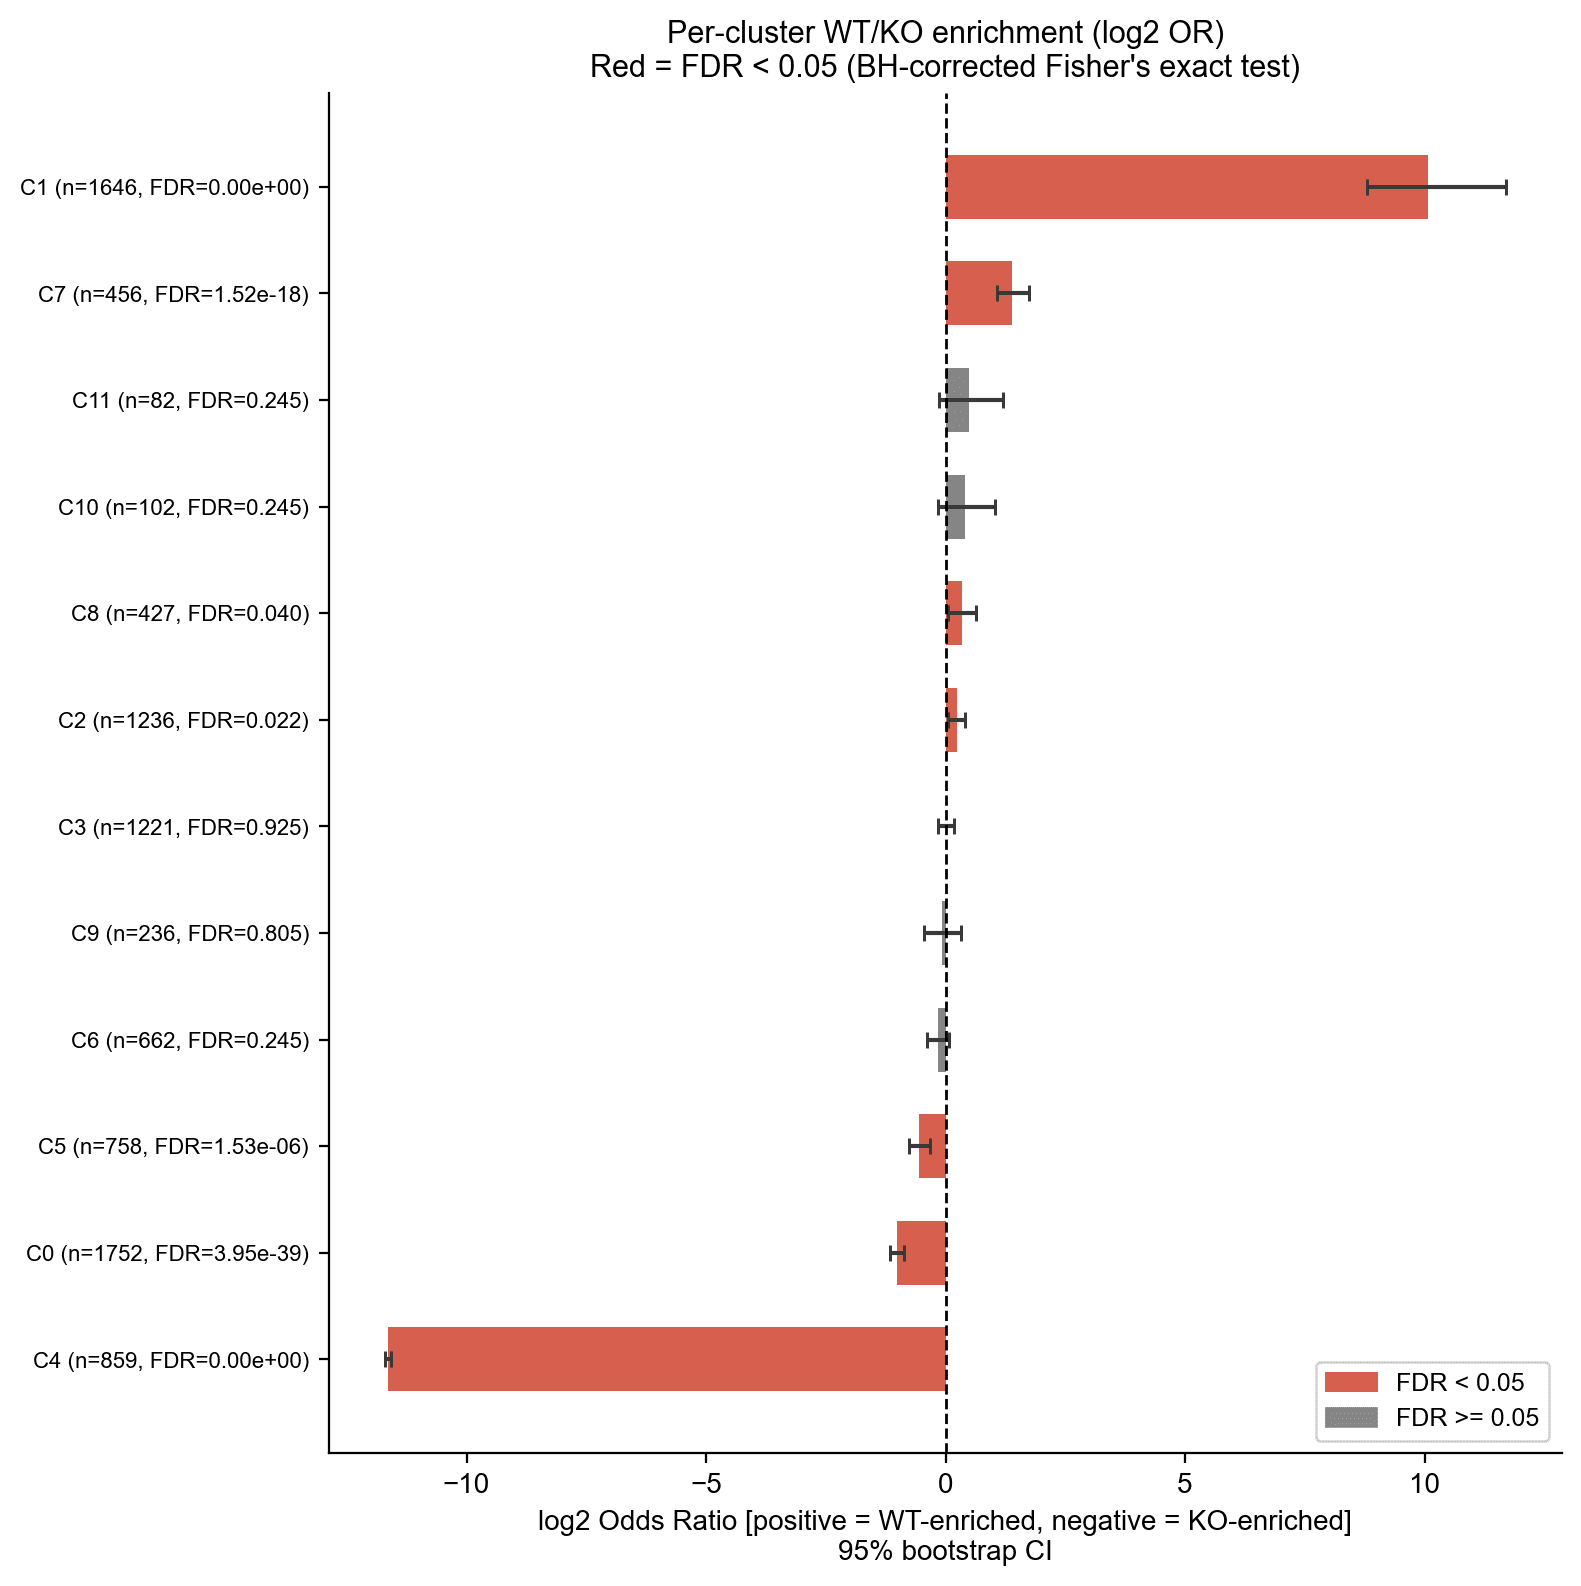
This aligns with the original study's distal-specific clusters (clusters 2 and 6) that were enriched for the HOXA13 motif and associated with digit morphogenesis gene ontology terms, and that were absent in Hox13-/- samples.
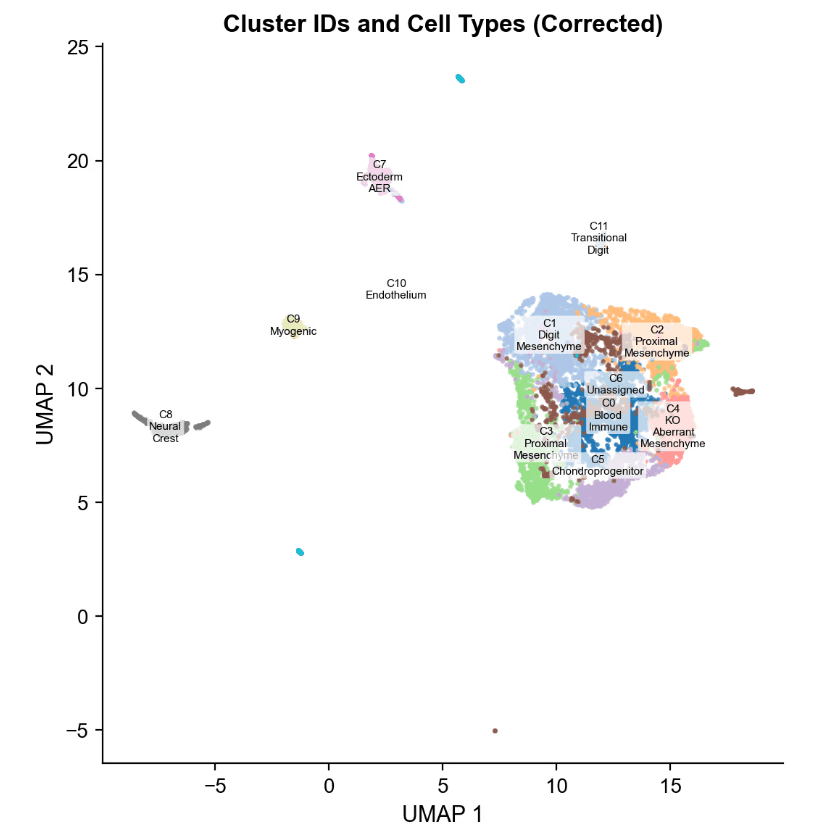
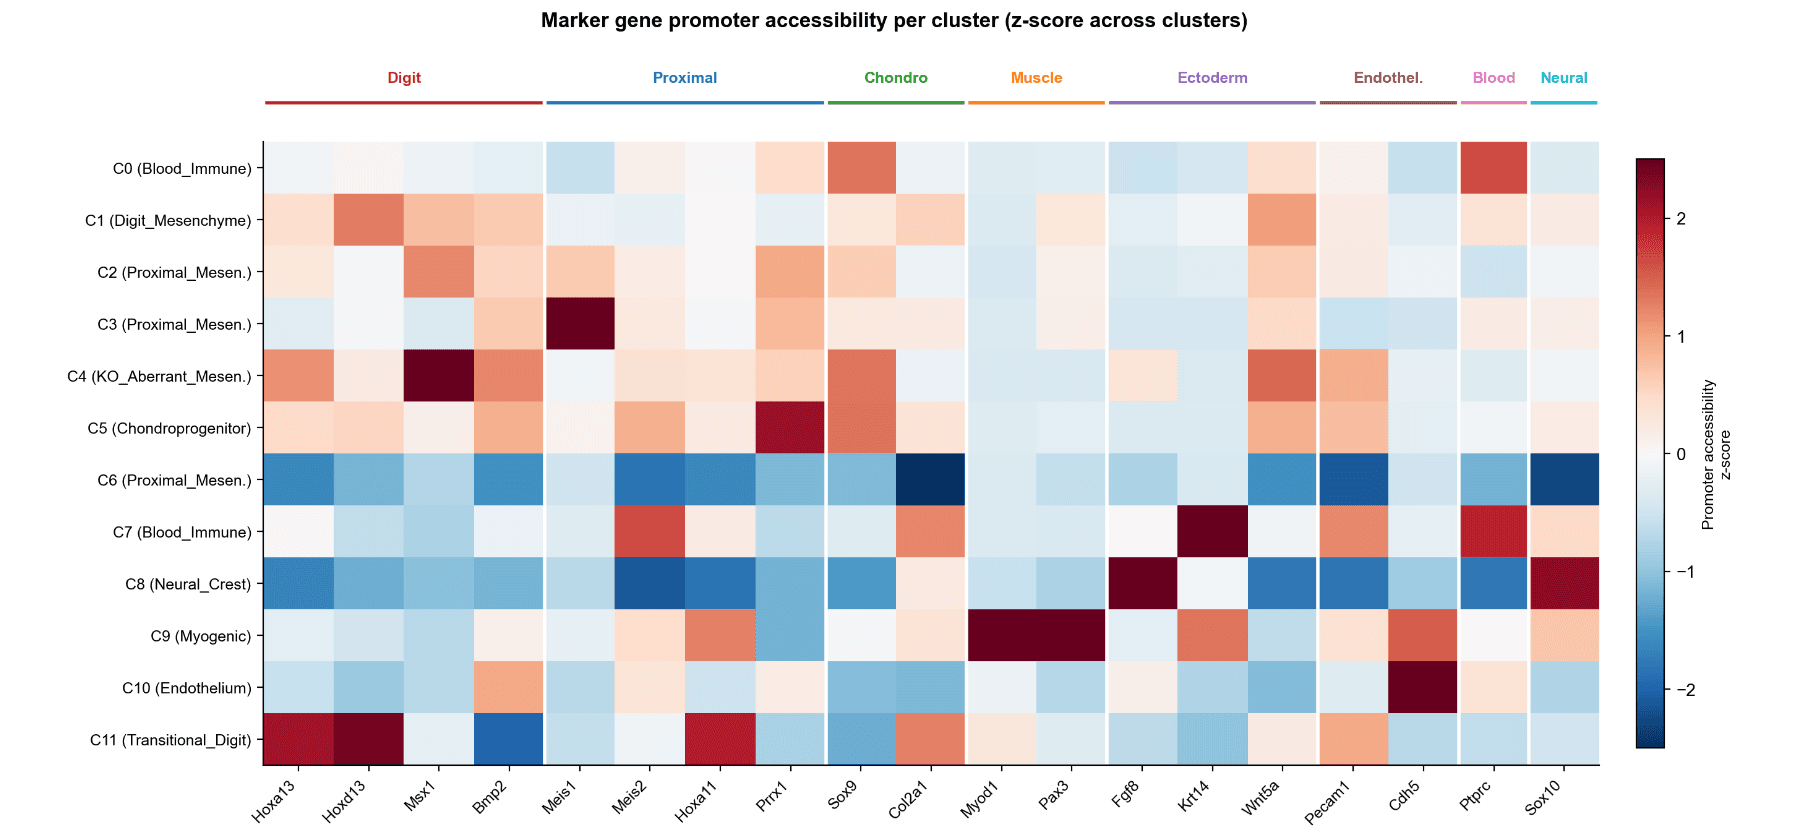
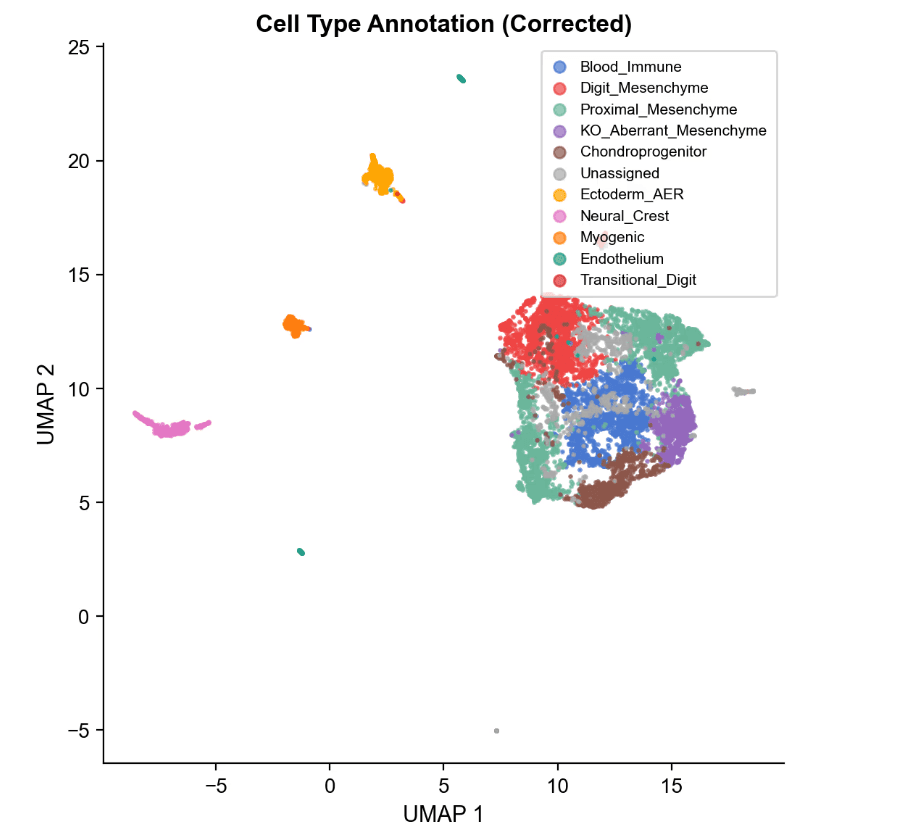
Cell-Type Identity by Marker Promoter Accessibility
- Cell-Type Annotation (Promoter Accessibility) 20 canonical limb-bud markers analyzed
- Z-score normalized promoter accessibility across 12 clusters
- Clear lineage grouping (digit, proximal, muscle, ectoderm, endothelium, immune, neural crest)
Key Mesenchymal States
- C1 (Digit Mesenchyme): High Hoxa13 / Hoxd13 Canonical HOX13-dependent distal state
- C11 (Transitional Digit) Even higher Hox13 accessibility More committed distal identity
- C4 (KO Aberrant, KO-exclusive) High Msx1, Bmp2 Loss of Hoxa13/Hoxd13 Stalled partial-distal state (not proximal reversion)
- C3 (Proximal Mesenchyme) High Meis1 Confirms proximal identity
Conclusion
- HOX13 establishes the distal digit chromatin state (C1)
- Loss of HOX13 prevents full digit program activation
- Cells divert into aberrant state (C4)
Cell-Type Identity by Marker Promoter Accessibility
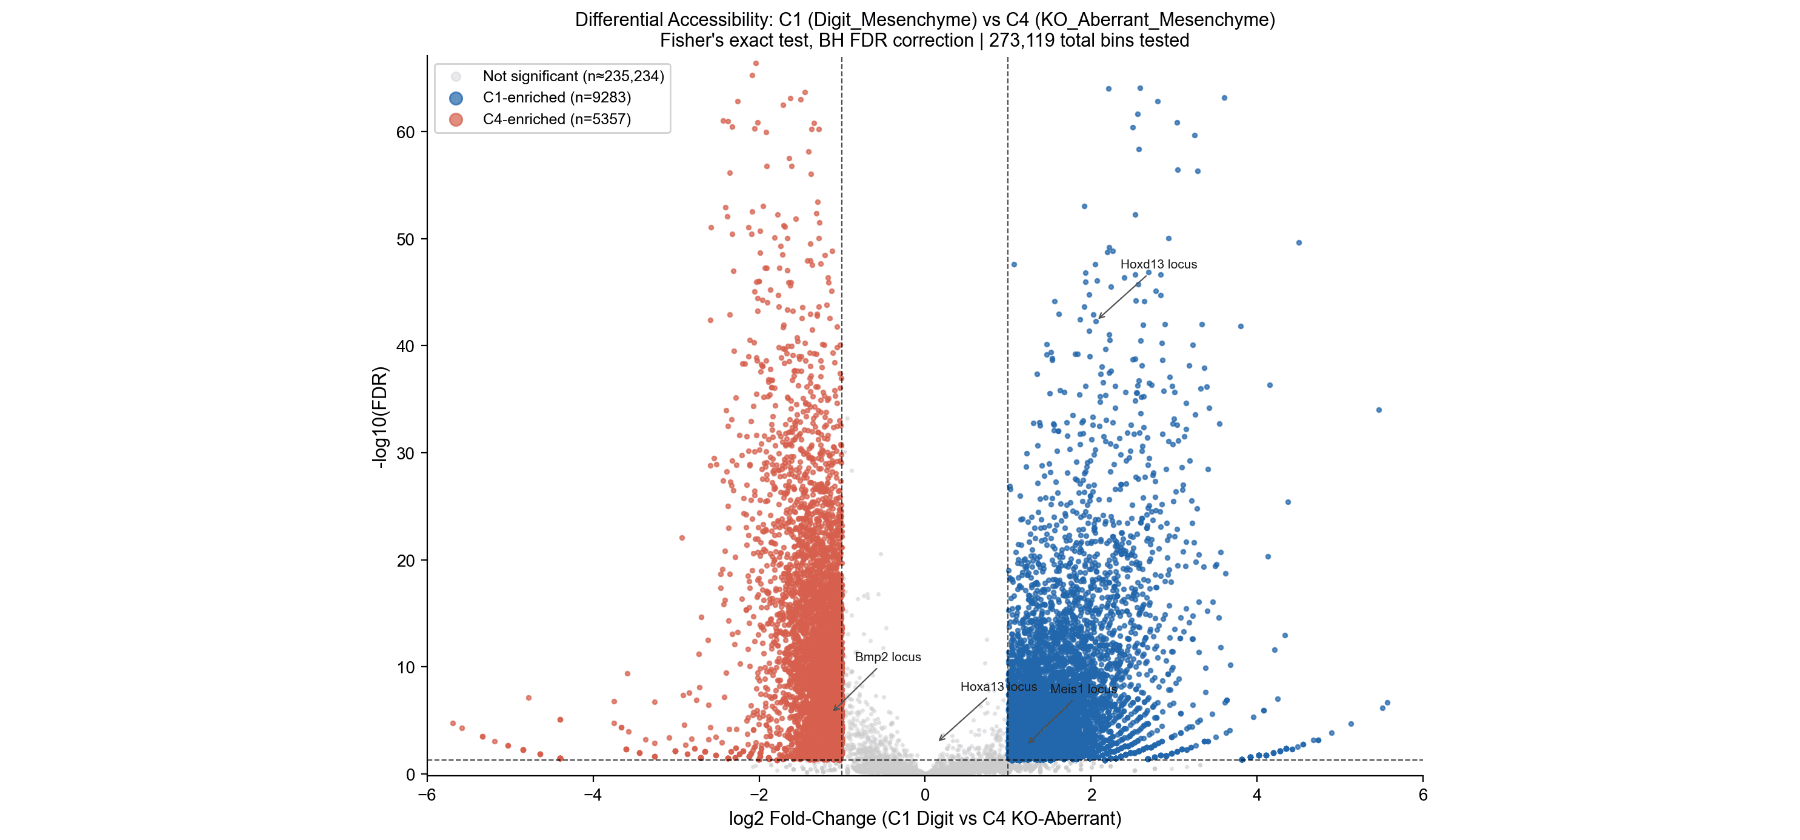
Differential Accessibility – Volcano Plot
Volcano plot of 273,119 10-kb bins.
- 9,283 regions more open in C1 (blue, including Hoxa13 and Hoxd13 loci).
- 5,357 regions more open in C4 (red, including Bmp2 locus). Almost 2:1 ratio shows HOX13 loss primarily prevents opening of correct loci.
-> Differential chromatin accessibility between C1 and C4 reveals HOX13-dependent regulatory landscapes:
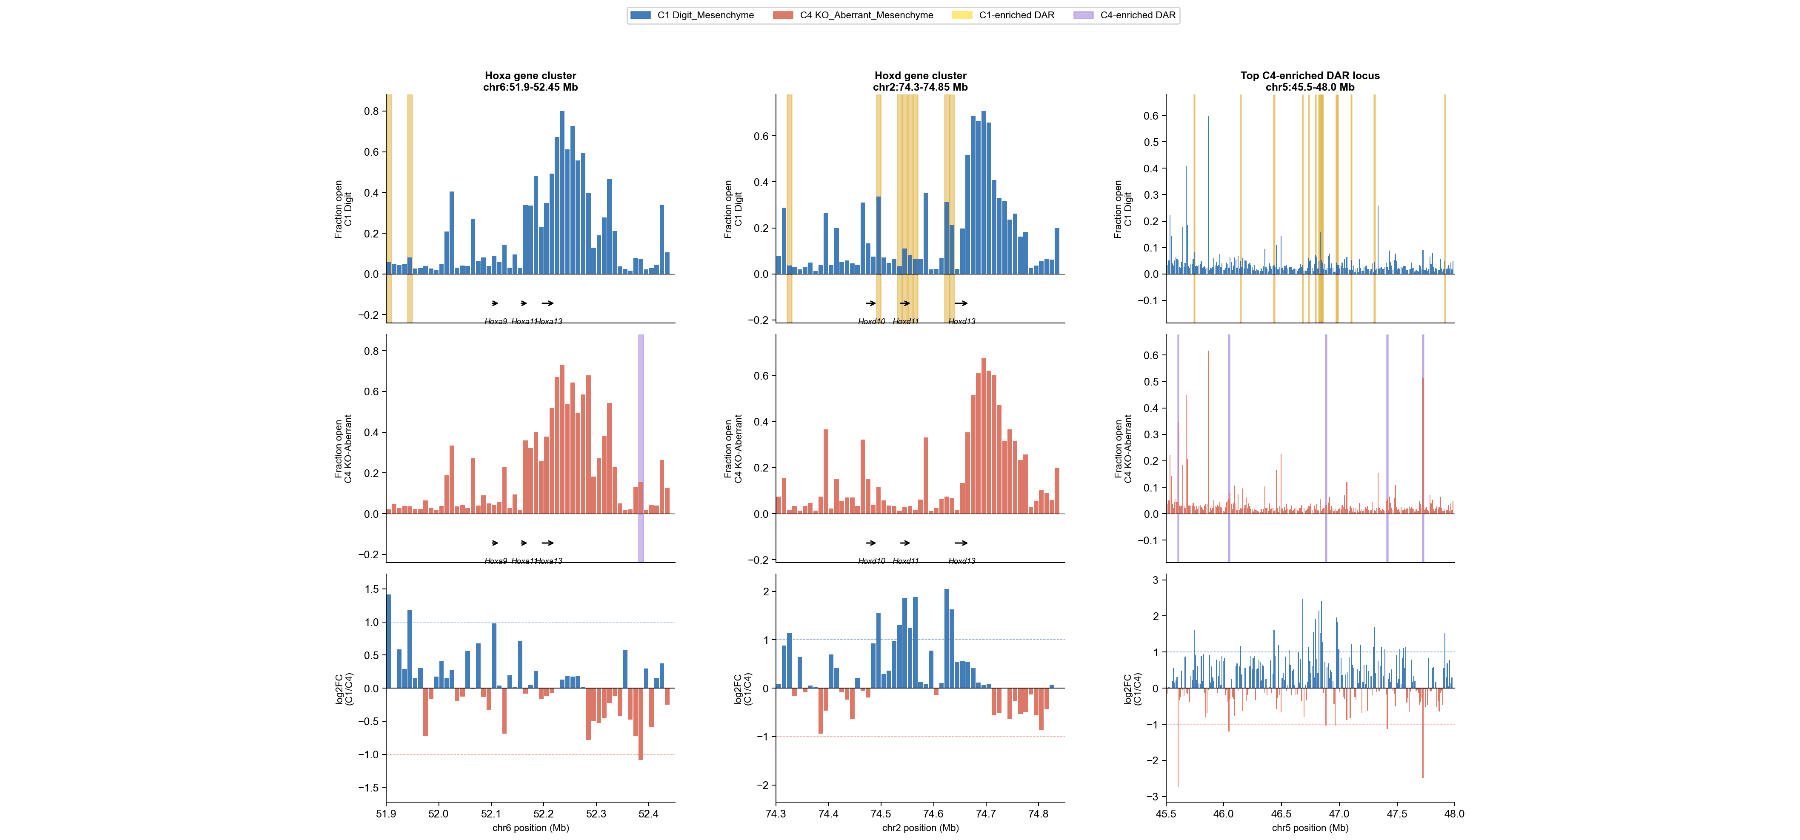
Genome Browser Tracks
Three representative loci.
Left & Middle: Strong C1-specific (yellow) peaks at Hoxa and Hoxd clusters.
Right: Multiple C4-specific (purple) peaks at chr5:45.5–48.0 Mb (aberrant opening).
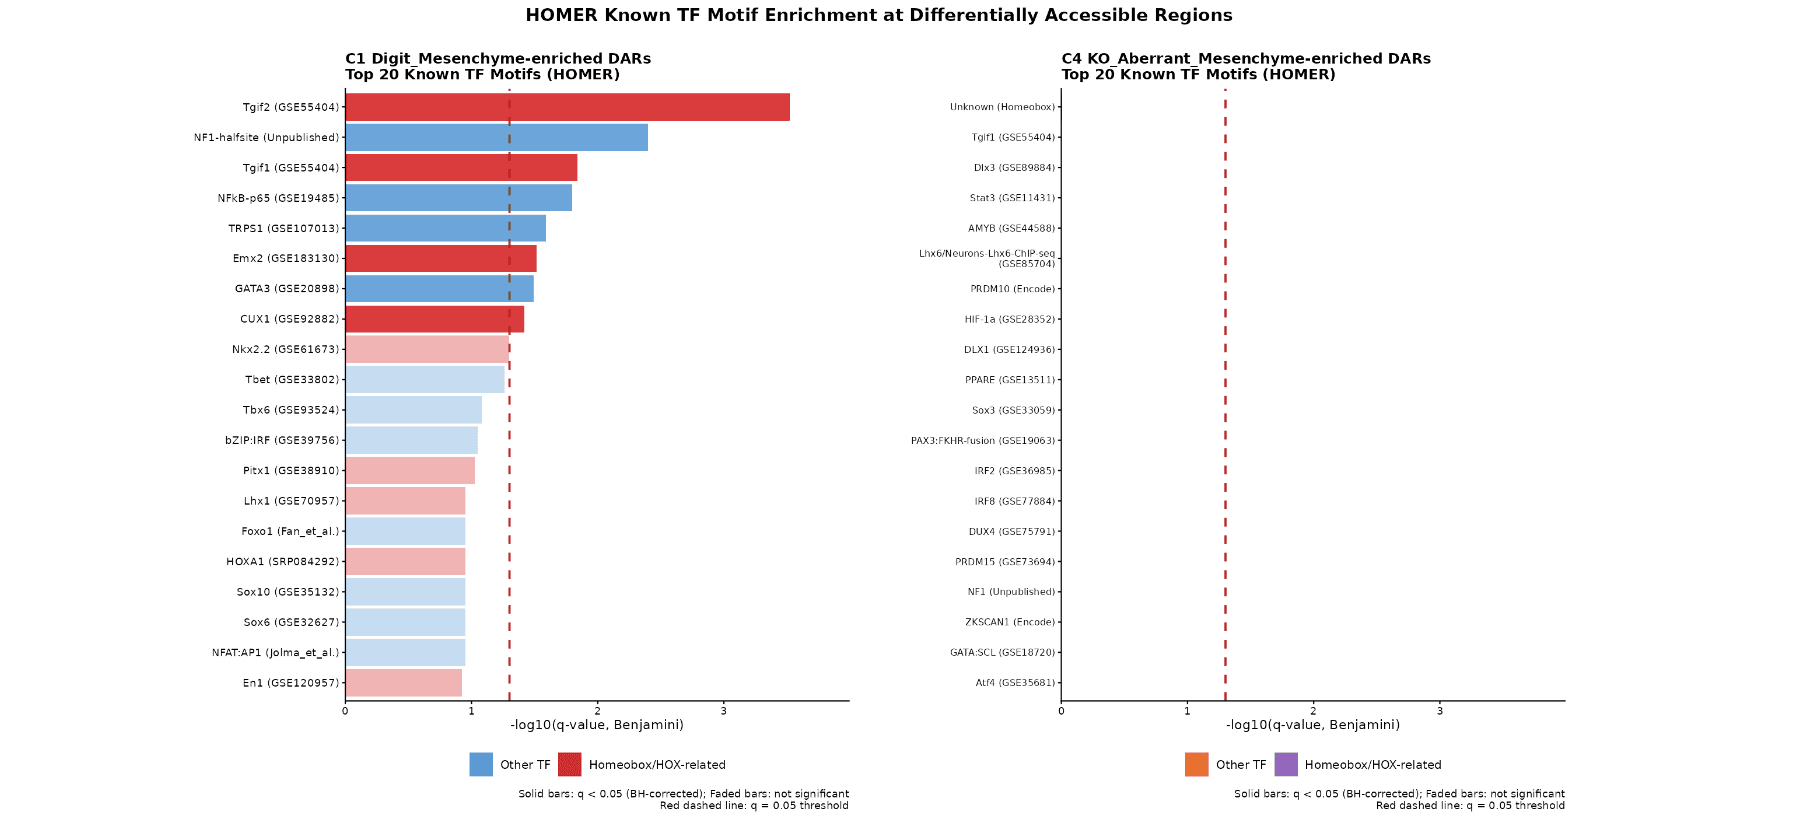
HOMER TF Motif Enrichment
- C1 DARs: 8 significant motifs (q < 0.05), 5 are Homeobox/TALE (top: Tgif2, q = 0.0003).
- C4 DARs: 0 significant motifs (best q = 0.99).
HOX13 works with TALE partners (TGIF1/2) to open digit enhancers; aberrant opening in KO is non-programmatic.
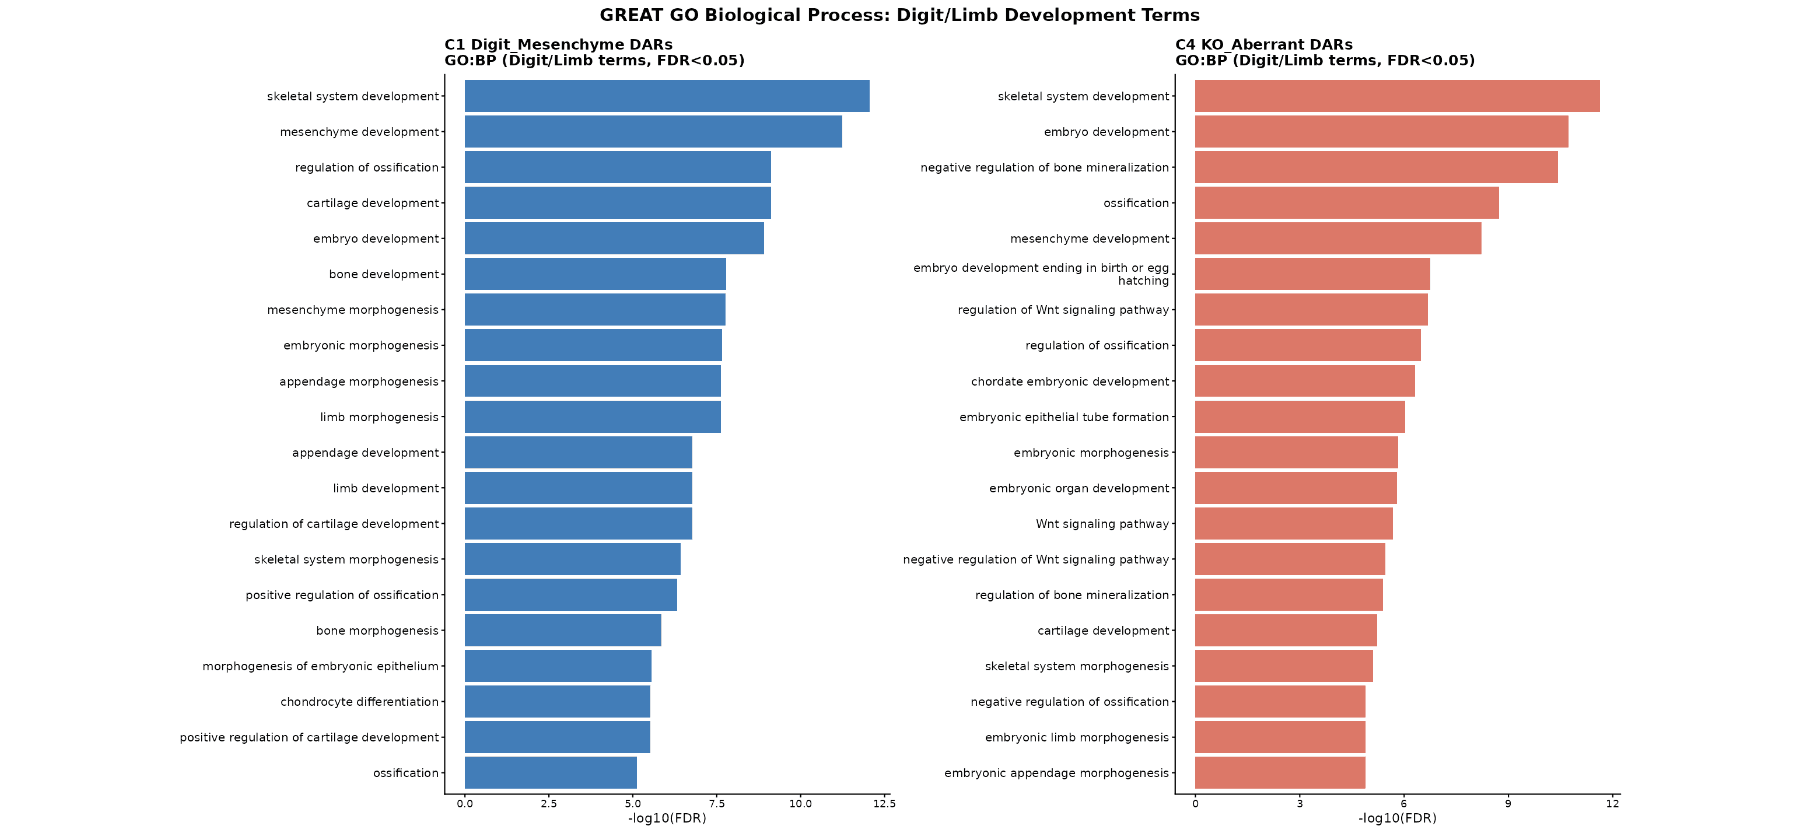
GREAT GO Biological Process Enrichment
DAR Set | Significant GO:BP (FDR < 0.05) | Key Digit/Limb Terms |
|---|---|---|
C1 | 1,709 | Skeletal system development (FDR = 8.8e-13), mesenchyme development (FDR = 5.8e-12), appendage/limb morphogenesis (FDR = 2.4e-8), cartilage development, regulation of ossification |
C4 | 1,917 | Skeletal system development, negative regulation of bone mineralization (FDR = 3.7e-11, fold = 3.78), regulation of Wnt signaling pathway (FDR = 2.1e-7), embryonic limb morphogenesis |