
Omics Data
Bulk RNA sequencing Analysis
Identify differentially expressed genes (DEGs) and key pathways driving differences between conditions
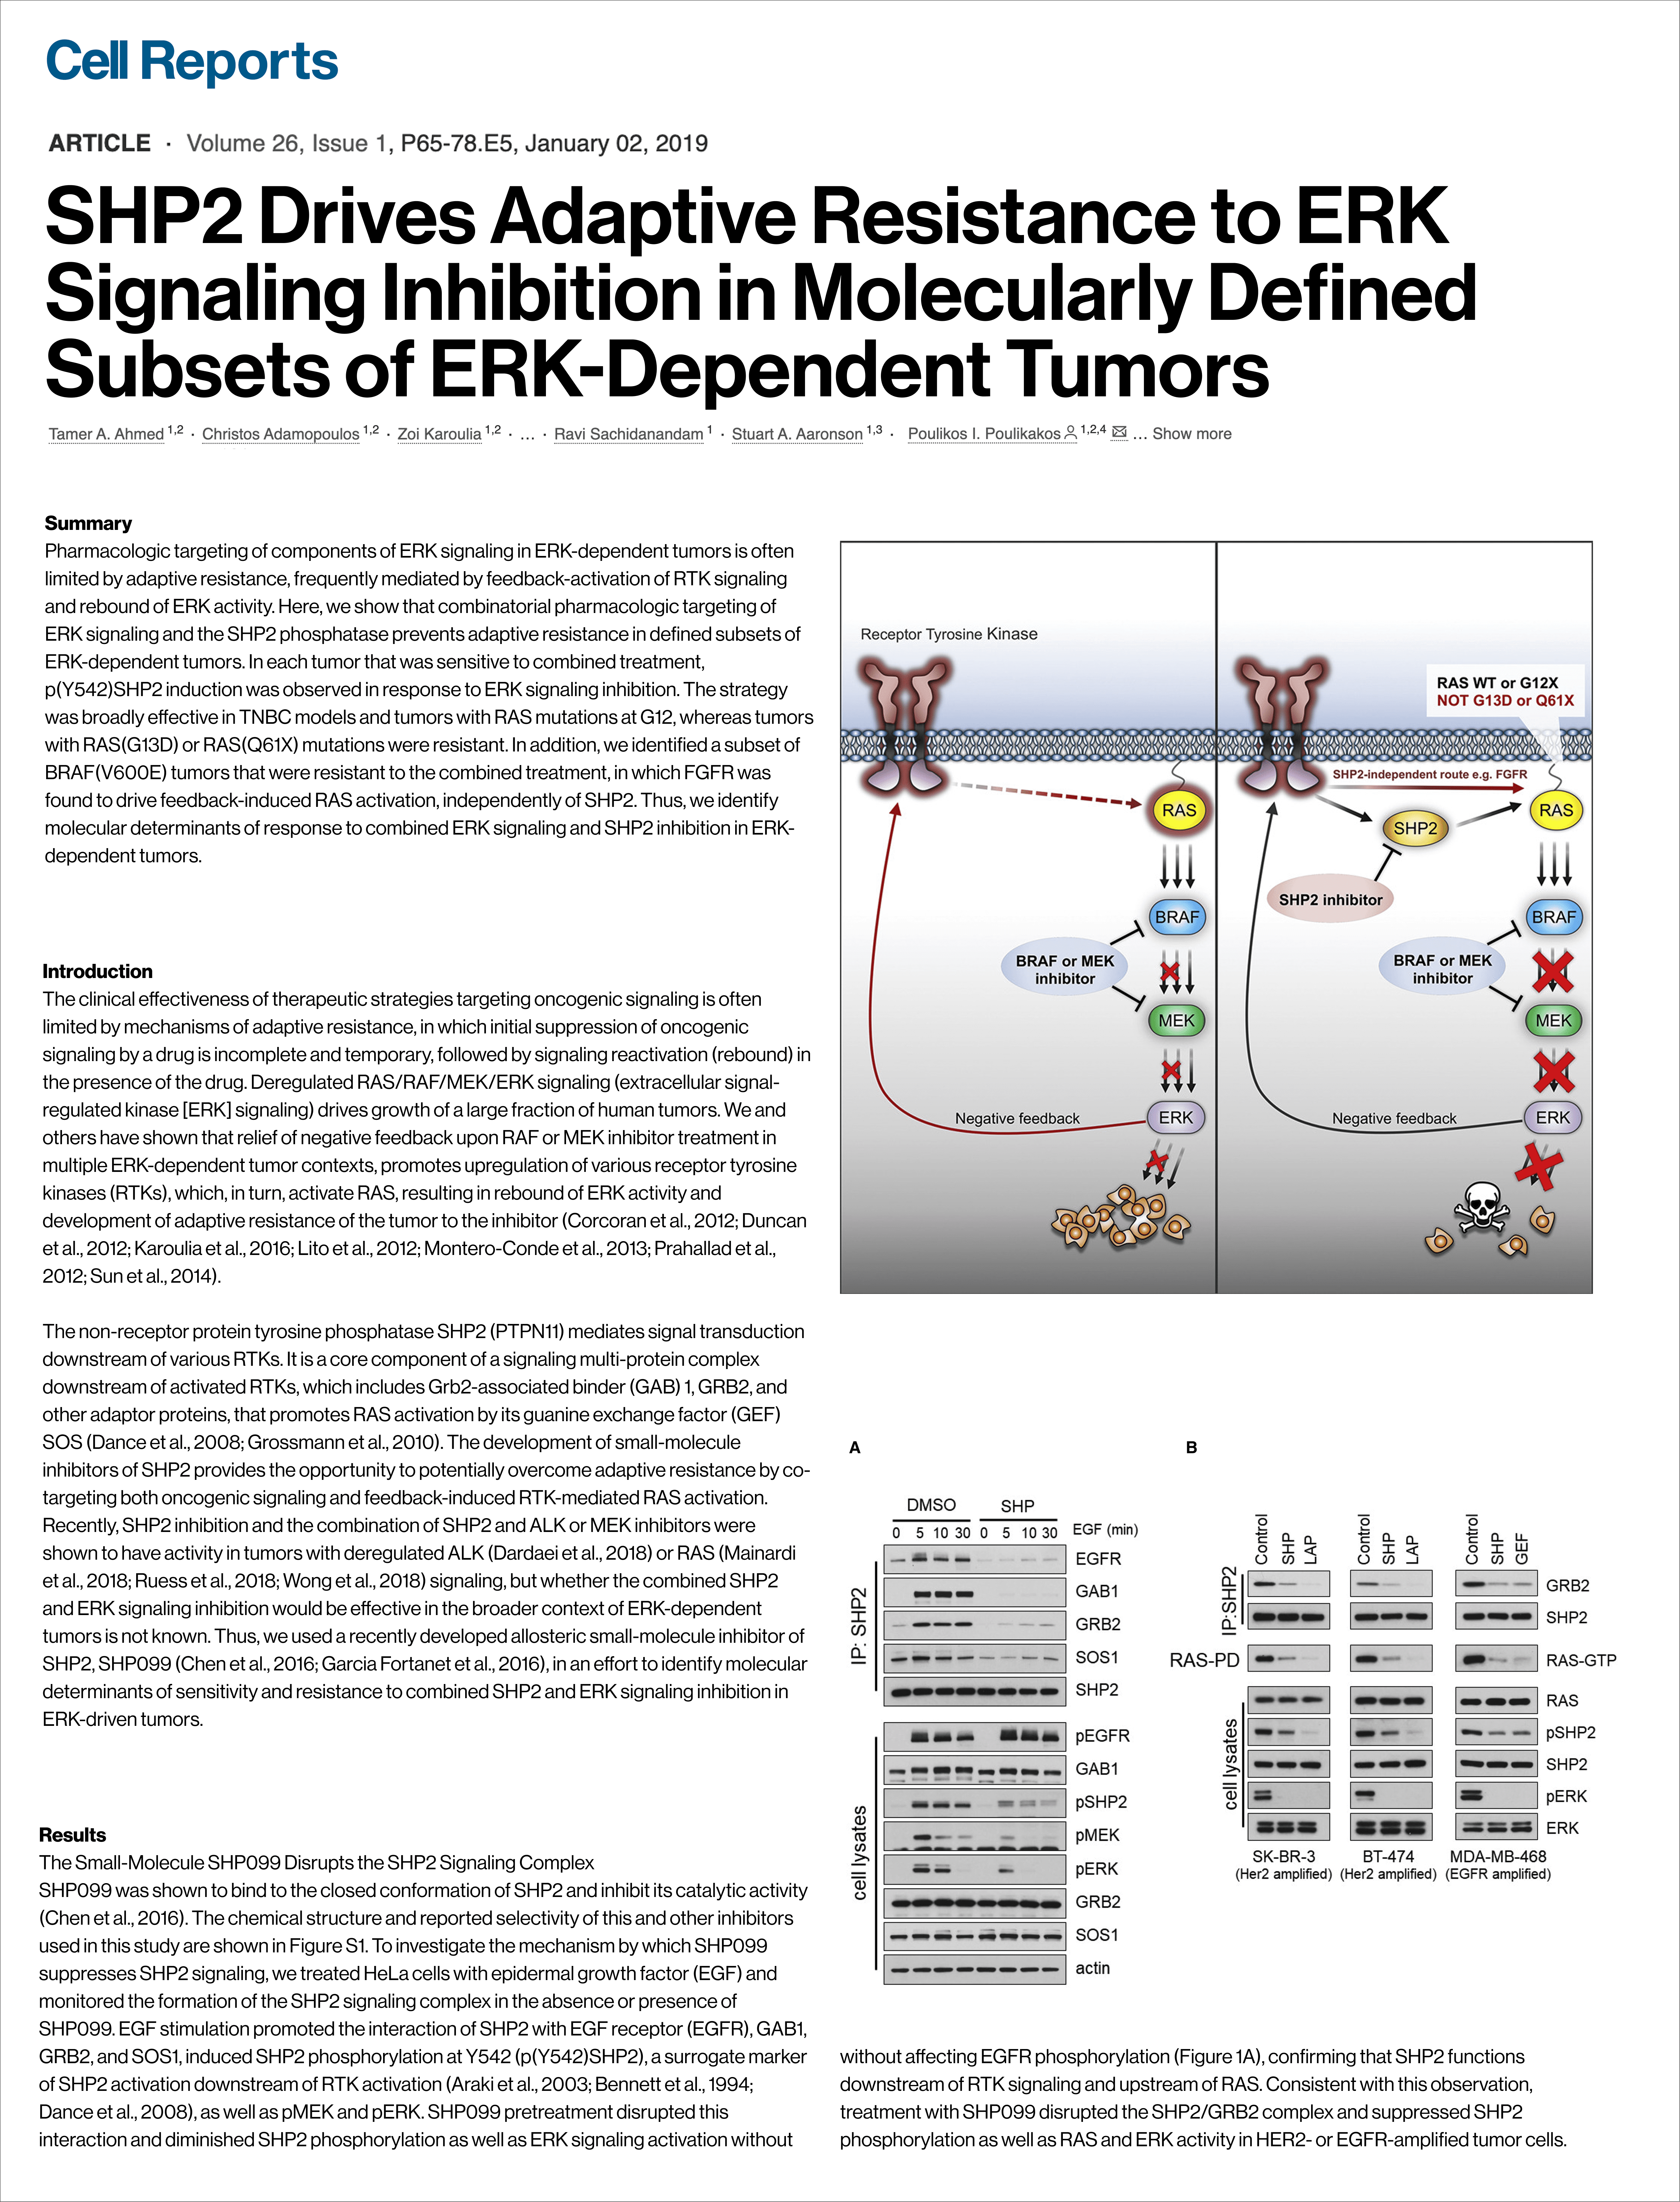
Original paper hypothesis
SHP2 mediates adaptive resistance to RAF/MEK inhibitors by coupling RTK-driven negative feedback to RAS reactivation. Combining SHP2 + ERK inhibition overcomes this, and p(Y542)SHP2 + RAS mutation subtype can predict response.
Dataset
RNA-seq data from GEO (GSE121117) used as the primary and sole dataset.
Only 3 cell lines from the original RNA-seq experiment: HTH104, sw1736, WIDR
Drylab analysis
Indirectly confirmed the molecular subtype distinction described in the paper: the HTH104/sw1736 (SHP2-negative, FGFR-dependent) vs. WIDR (SHP2-positive, EGFR-dependent) split was recapitulated entirely in the transcriptional data — these two groups separated on PC1, in hierarchical clustering, and in the RTK gene heatmap
PCA and Hierarchical Clustering
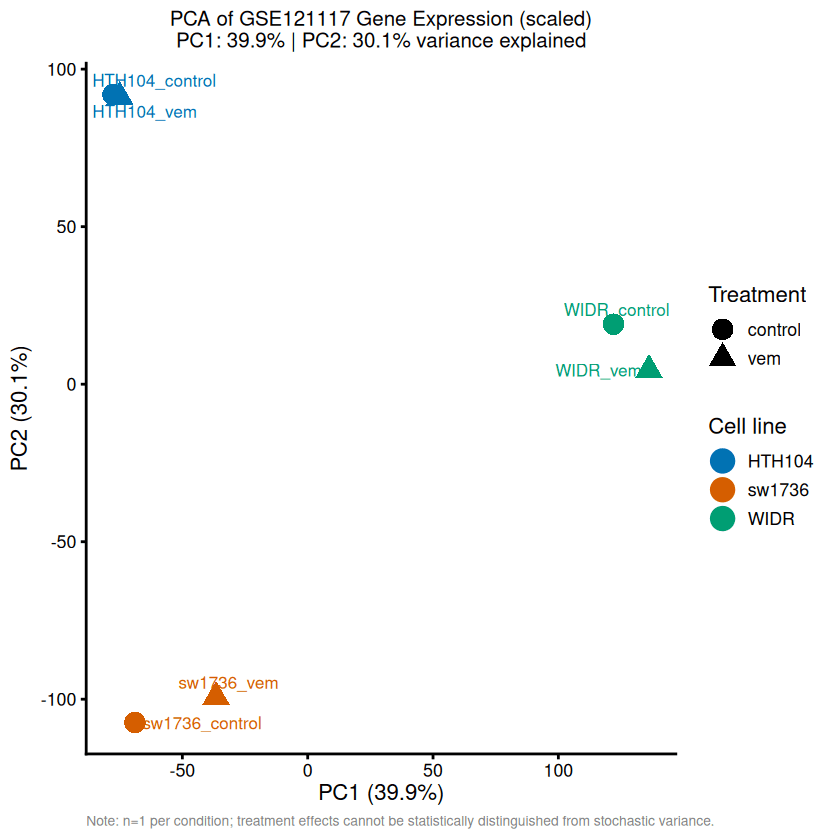
PC1 (39.9%) and PC2 (30.1%) together explain 70.0% of the total variance. After scaling, variance is distributed more evenly compared to the unscaled analysis (85.9% for PC1+PC2), indicating that a few high-variance genes previously inflated PC1.
PC1 primarily separates samples by tissue of origin: WIDR (colorectal) clusters apart from HTH104 and SW1736 (thyroid ATC). Notably, although SW1736 and WIDR both carry the BRAF-V600E mutation, they fall on opposite branches, suggesting mutation status is not the main driver of transcriptomic variation. Instead, cell-line identity dominates, while treatment effects are comparatively subtle.
Control and vemurafenib samples cluster closely within each cell line, indicating that baseline transcriptomic differences between cell lines exceed drug-induced changes.
This pattern is consistent with adaptive resistance occurring largely through post-translational signaling reactivation
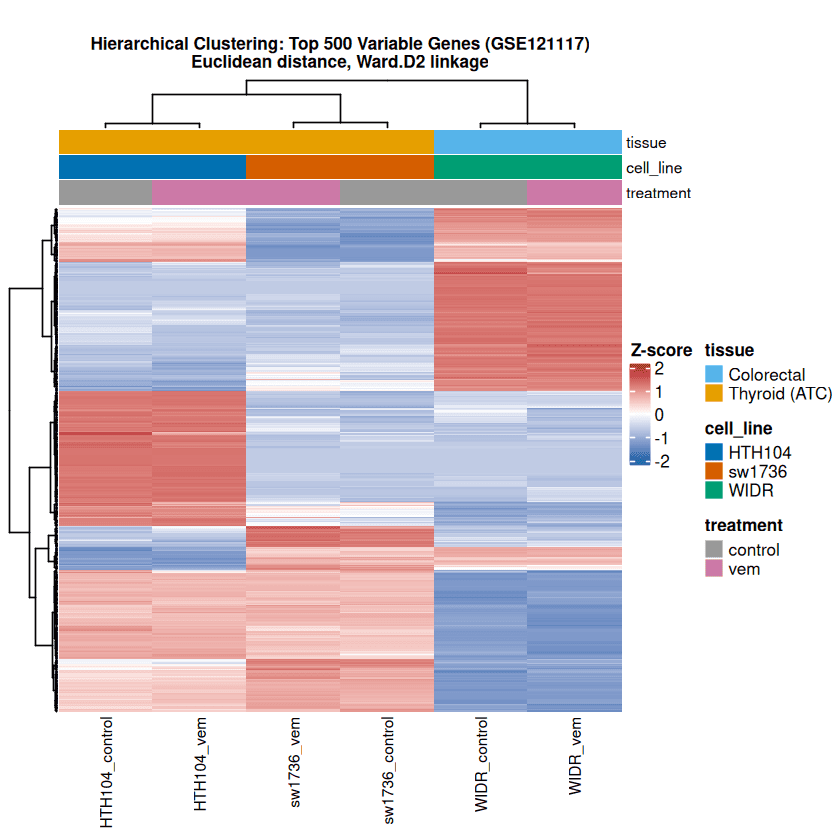
The column dendrogram shows a clear primary split between thyroid (ATC) and colorectal samples.
Two major gene programs emerge: one block upregulated in HTH104 and SW1736 but repressed in WIDR, and another strongly expressed in WIDR. This bipartite pattern aligns with tissue origin and SHP2 dependency, rather than mutational background, since all three lines harbor BRAF-V600E.
Vemurafenib treatment causes only subtle shifts within each cell line, consistent with the PCA results and the n = 1 design, which prevents formal statistical testing of treatment effects.
RTK Signaling Gene Analysis
A curated set of 159 RTK signaling genes (receptors, ligands, RAS regulators, cytokines, chemokines) was assembled from literature,
MSigDB Reactome/KEGG pathways, and GSEA leading-edge genes. Genes were mapped to the dataset. Row-wise Z-scores were computed across six samples and capped at ±2.5 SD. A tissue-difference score (WIDR mean Z − thyroid mean Z) quantified lineage bias. Heatmaps were generated using ComplexHeatmap with Ward.D2 hierarchical clustering.
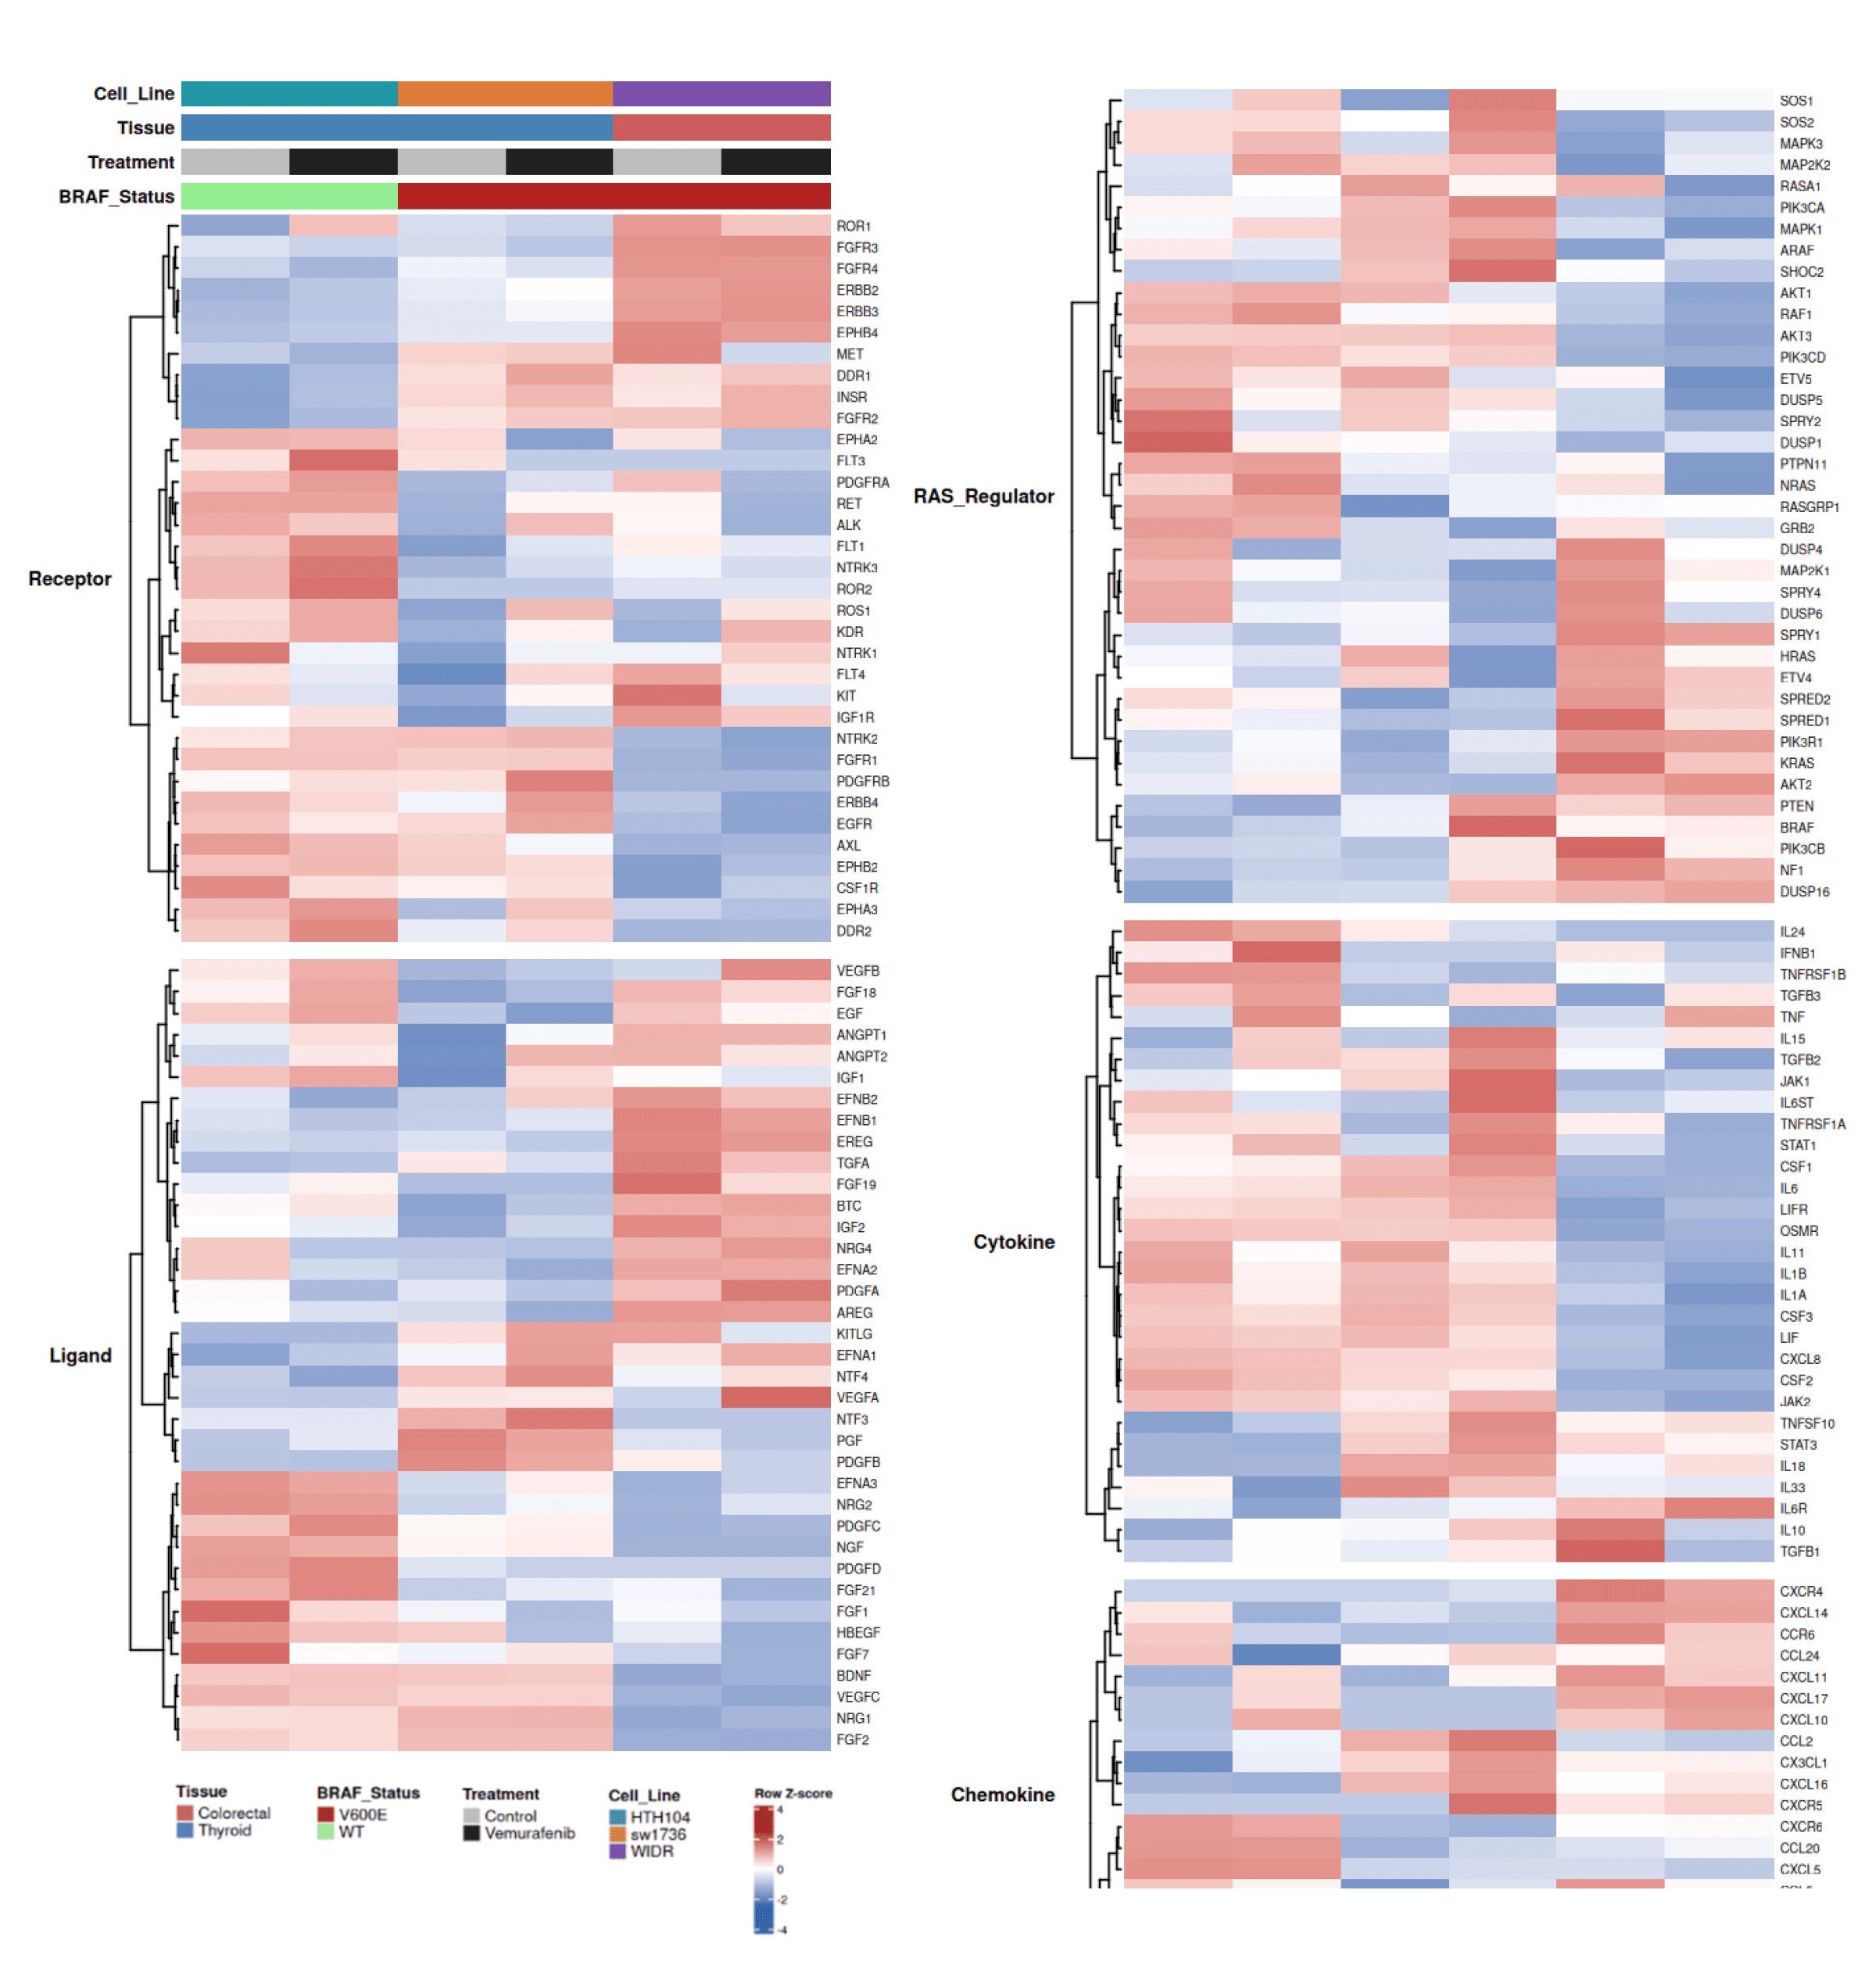
• Gene coverage: High for receptors, ligands, and RAS regulators (97–100%); lower for cytokines/chemokines (53–79%), consistent with limited immune gene expression in epithelial cell lines.
• Tissue-specific RTK programs: A clear bipartite pattern separates thyroid ATC and colorectal WIDR. WIDR-enriched genes include EREG, FGFR3, CXCR4, EFNB1, EPHB4; ATC-enriched genes include BDNF, OSMR, FGFR1, AKT3, VEGFC.
• Receptor differences: FGFR3/4 and ERBB2/3 are higher in WIDR, while FGFR1 and IGF1R are higher in ATC.
• Ligand differences: EGFR ligands (AREG, EREG, TGFA) are enriched in WIDR, whereas FGF2, BDNF, and VEGFC are enriched in ATC.
• RAS feedback regulators: Distinct MAPK feedback wiring is observed (e.g., SPRY1 enriched in WIDR).
RTK signaling programs differ by lineage. ATC lines show an FGFR1–FGF2 axis, whereas WIDR exhibits an FGFR3/4 and EGFR ligand program (AREG/EREG/ERBB3) consistent with EGFR–SHP2 signaling. Additional PI3K/AKT isoform differences (PIK3CD/AKT3 in ATC vs. PIK3R1 in WIDR) suggest parallel survival pathways
FGFR/ErbB Family and SHP2/GRB2/RAS Analysis
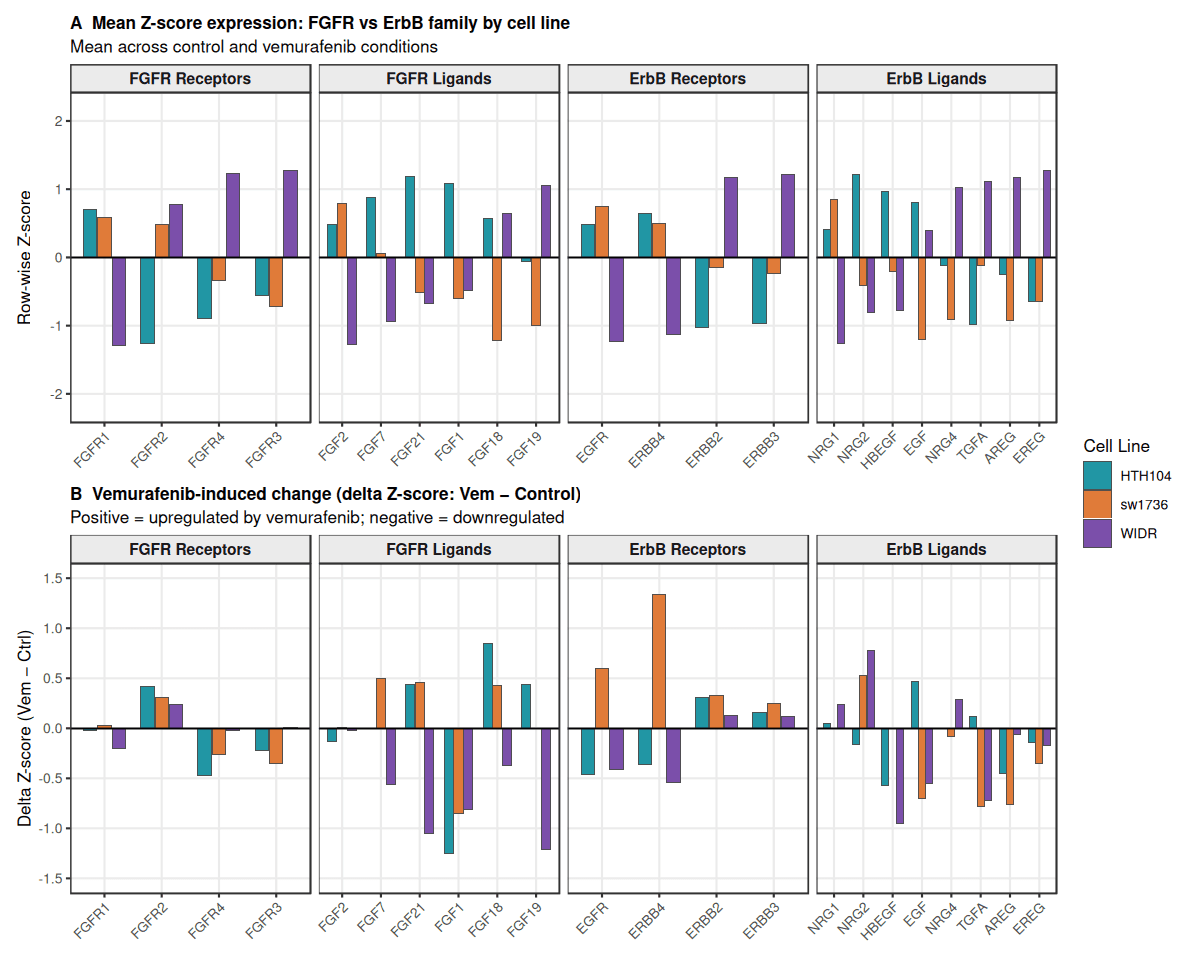
Panel A – Baseline RTK programs
Baseline expression reveals clear lineage-specific RTK signaling differences. Thyroid lines (HTH104, SW1736) show higher FGFR signaling, particularly FGFR1 and its ligand FGF2, consistent with an FGFR-driven program.
In contrast, WIDR exhibits stronger ErbB network activity, including ERBB3 and EGFR ligands (AREG, EREG), alongside higher FGFR3/4 expression. This pattern reflects a FGFR1 (thyroid) → FGFR3/4 (colorectal) isoform shift, consistent with known tumor biology.
Panel B – Vemurafenib response
Analysis of ΔZ-scores shows distinct adaptive responses to BRAF inhibition. Thyroid models display modest transcriptional changes primarily in FGFR ligands, suggesting ligand-driven FGFR activation. SW1736 additionally upregulates EGFR/ERBB4, consistent with compensatory RTK signaling after ERK inhibition. In contrast, WIDR shows minimal transcriptional changes, indicating that resistance likely occurs through post-translational signaling mechanisms (e.g., ERBB3–SHP2 coupling) rather than large transcriptional shifts.
Overall, the results show that ERK pathway inhibition triggers lineage-specific RTK feedback programs: thyroid models preferentially activate FGFR signaling, whereas the colorectal model relies more on the ErbB network, supporting the tumor-specific adaptive resistance mechanism described in Ahmed et al., 2019.
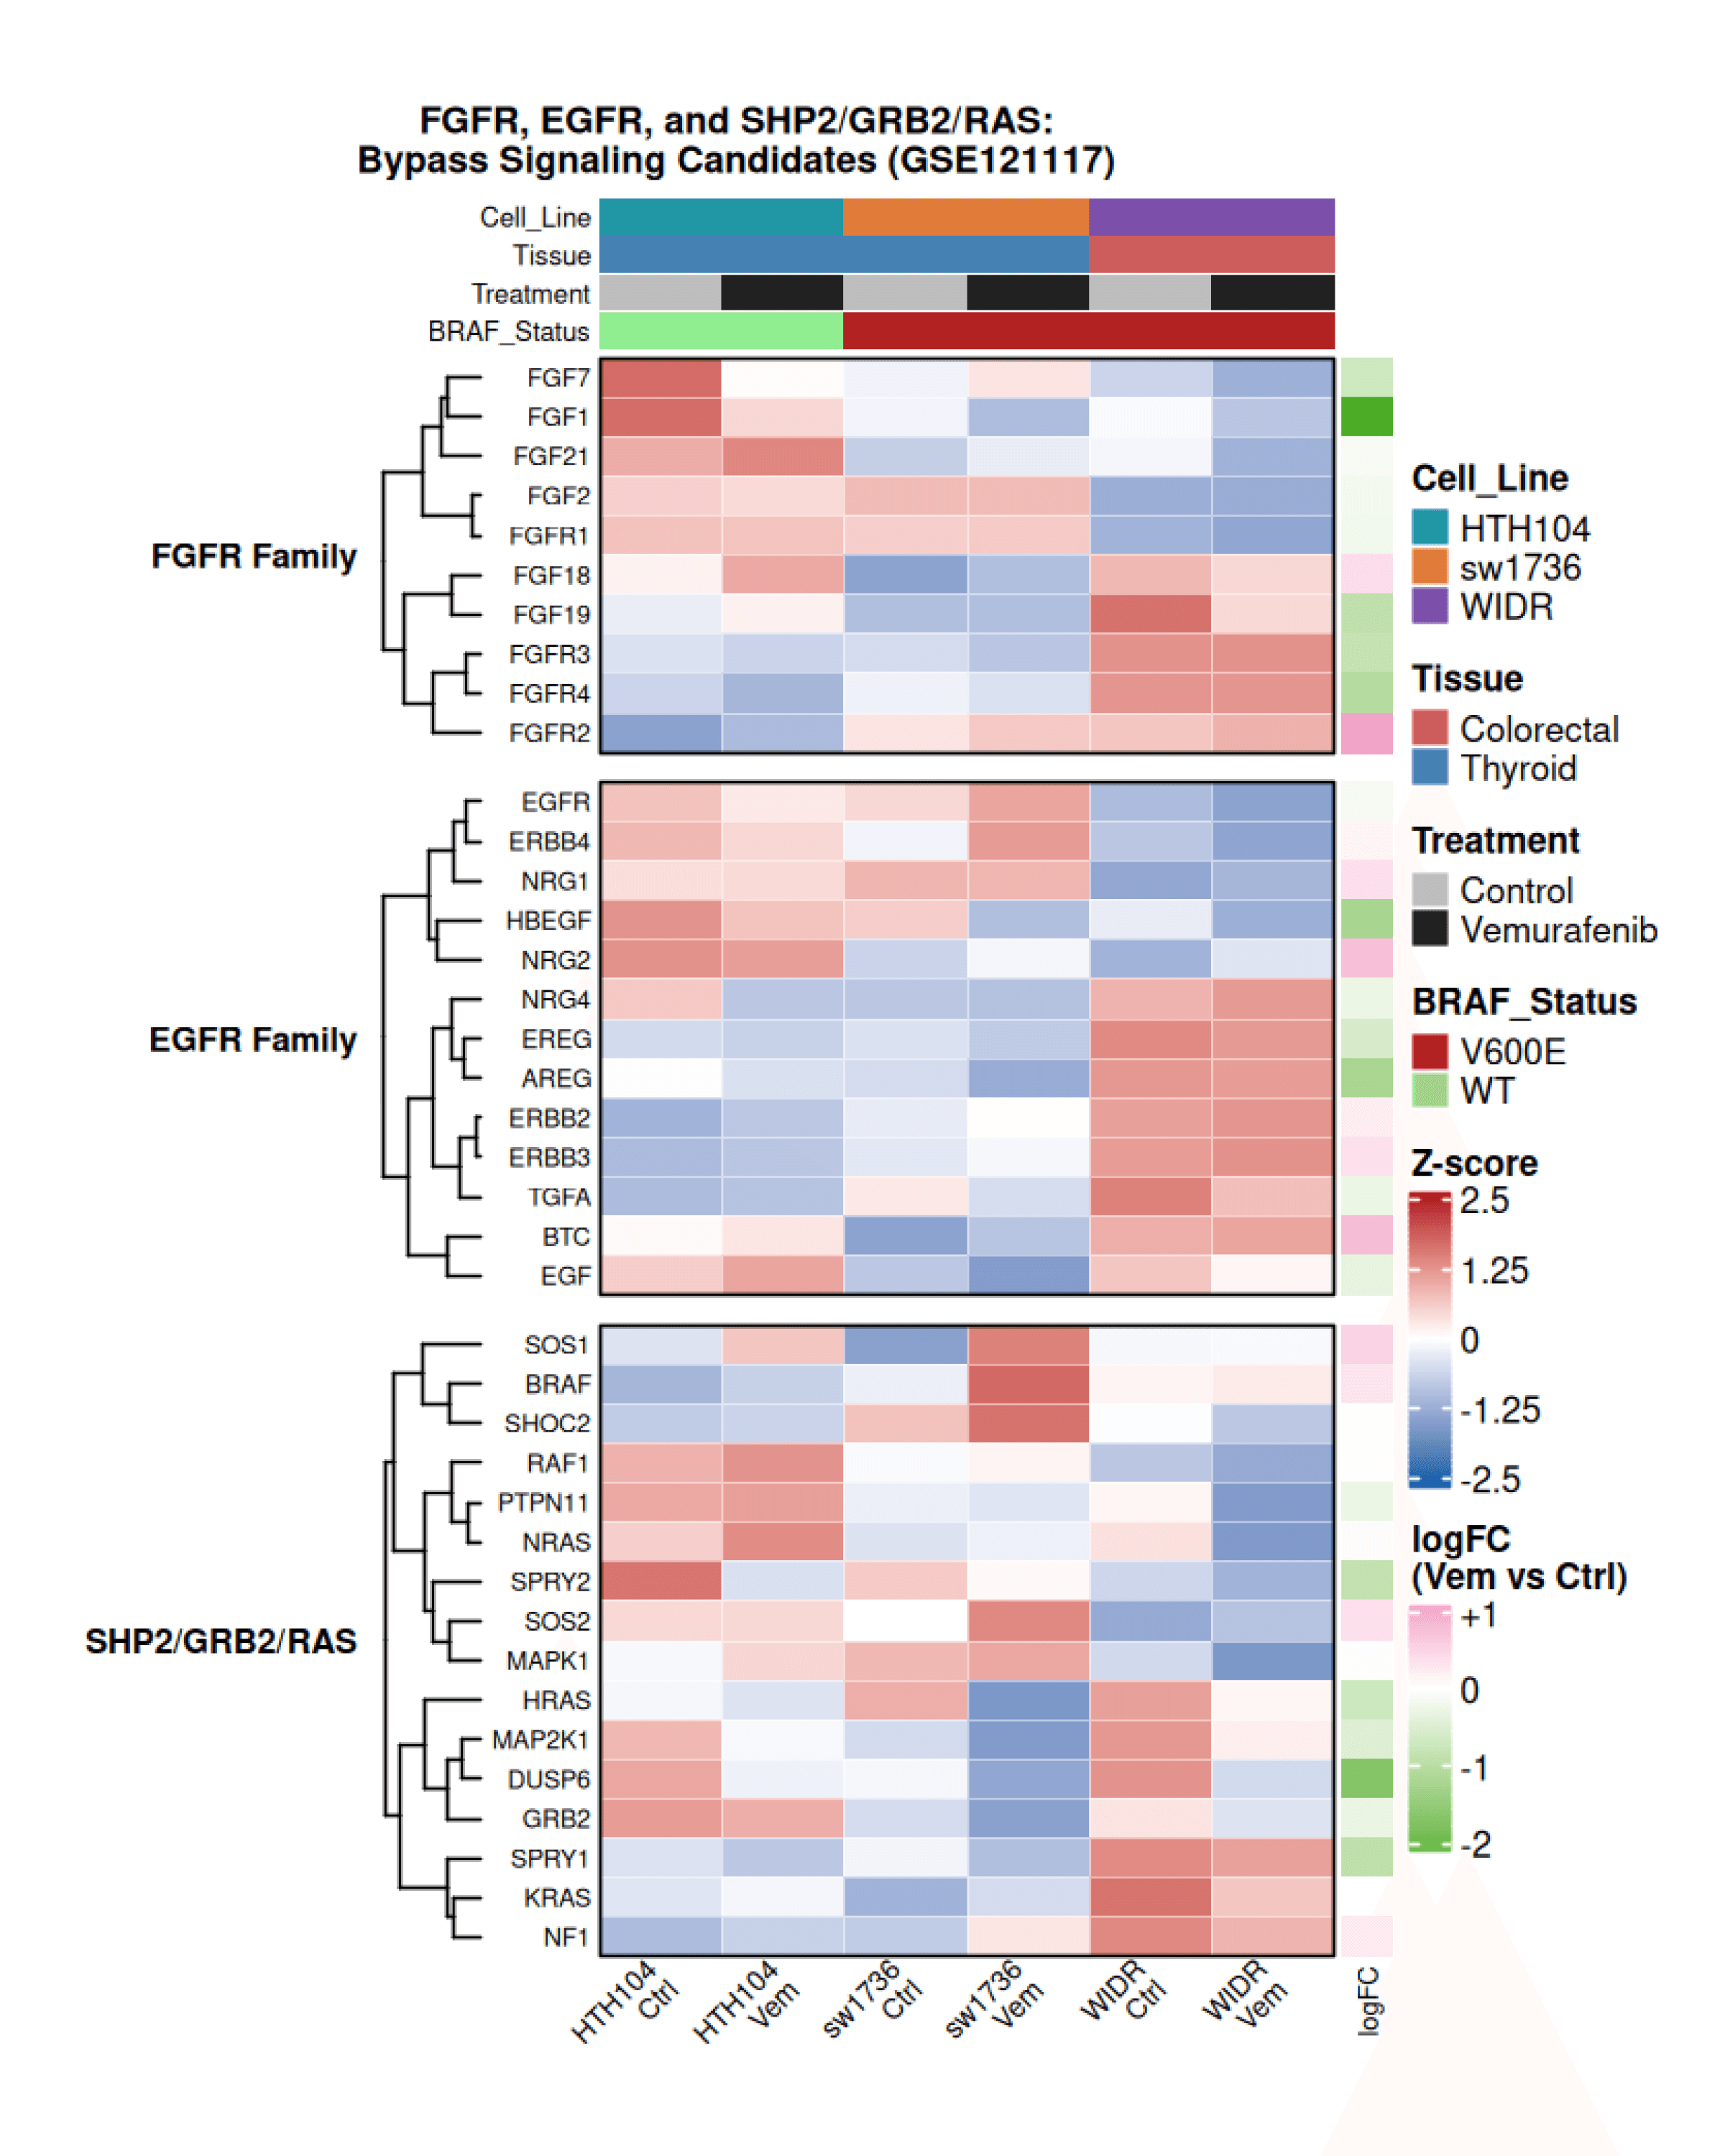
To investigate potential bypass signaling after ERK inhibition, we examined genes involved in FGFR, EGFR/ErbB, and SHP2/GRB2/RAS signaling.
Hierarchical clustering of row-normalized expression revealed clear lineage-specific patterns. Thyroid-derived lines (HTH104, SW1736) showed higher baseline FGFR ligand and receptor expression, while the colorectal line WIDR exhibited stronger EGFR/ErbB pathway activity.
Following vemurafenib treatment, thyroid models maintained or increased FGFR signaling, whereas WIDR showed stronger activation of EGFR/ErbB components and downstream RAS signaling. Differential expression of SHP2/GRB2/RAS genes further supports a model where MAPK inhibition triggers tumor-specific RTK-driven bypass signaling, consistent with the mechanism described in Ahmed et al., 2019.
Differential expression analysis and gene set enrichment analysis (GSEA)
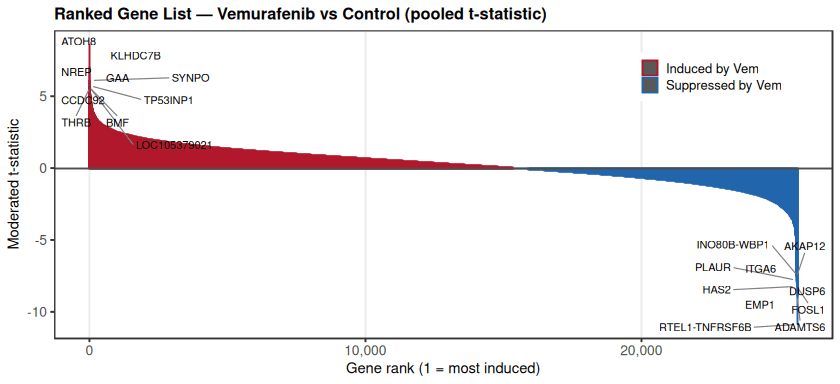
Genome-wide ranking of differential gene expression between vemurafenib-treated and control samples further revealed the global transcriptional shift induced by ERK pathway inhibition.
The ranked distribution showed a clear asymmetry, with a subset of genes strongly induced by vemurafenib (positive t-statistics) and another subset strongly suppressed (negative t-statistics). Among the most significantly induced genes were ATOH8, KLHDC7B, SYNPO, TP53INP1, and NREP, suggesting activation of stress-response and transcriptional adaptation programs following MAPK pathway blockade.
In contrast, genes such as FOSL1, DUSP6, HAS2, ITGA6, PLAUR, and ADAMTS6 were among the most strongly downregulated, many of which are associated with ERK/MAPK signaling output or extracellular matrix remodeling. The overall distribution indicates that BRAF inhibition does not produce uniform transcriptional repression but rather reprograms a defined subset of genes involved in signaling feedback and cellular adaptation.
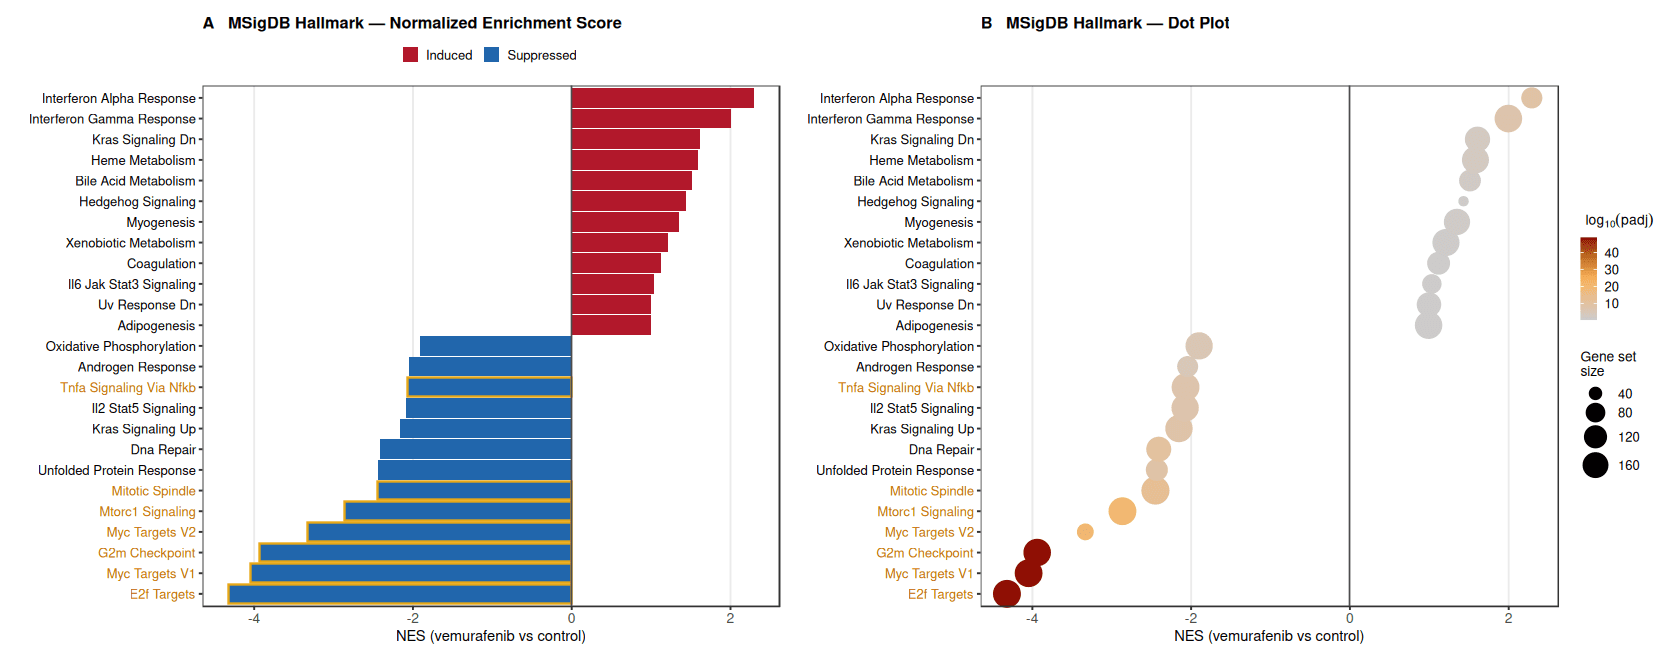
Hallmark pathway analysis revealed a clear separation between pathways induced and suppressed upon ERK pathway inhibition.
Immune and stress-associated pathways, including Interferon Alpha Response, Interferon Gamma Response, and IL6–JAK–STAT3 signaling, were significantly enriched among genes upregulated after treatment.
In contrast, pathways associated with cell proliferation and growth control were strongly suppressed, including E2F Targets, MYC Targets (V1/V2), G2M Checkpoint, and MTORC1 signaling, indicating a global reduction in proliferative transcriptional programs following BRAF inhibition.
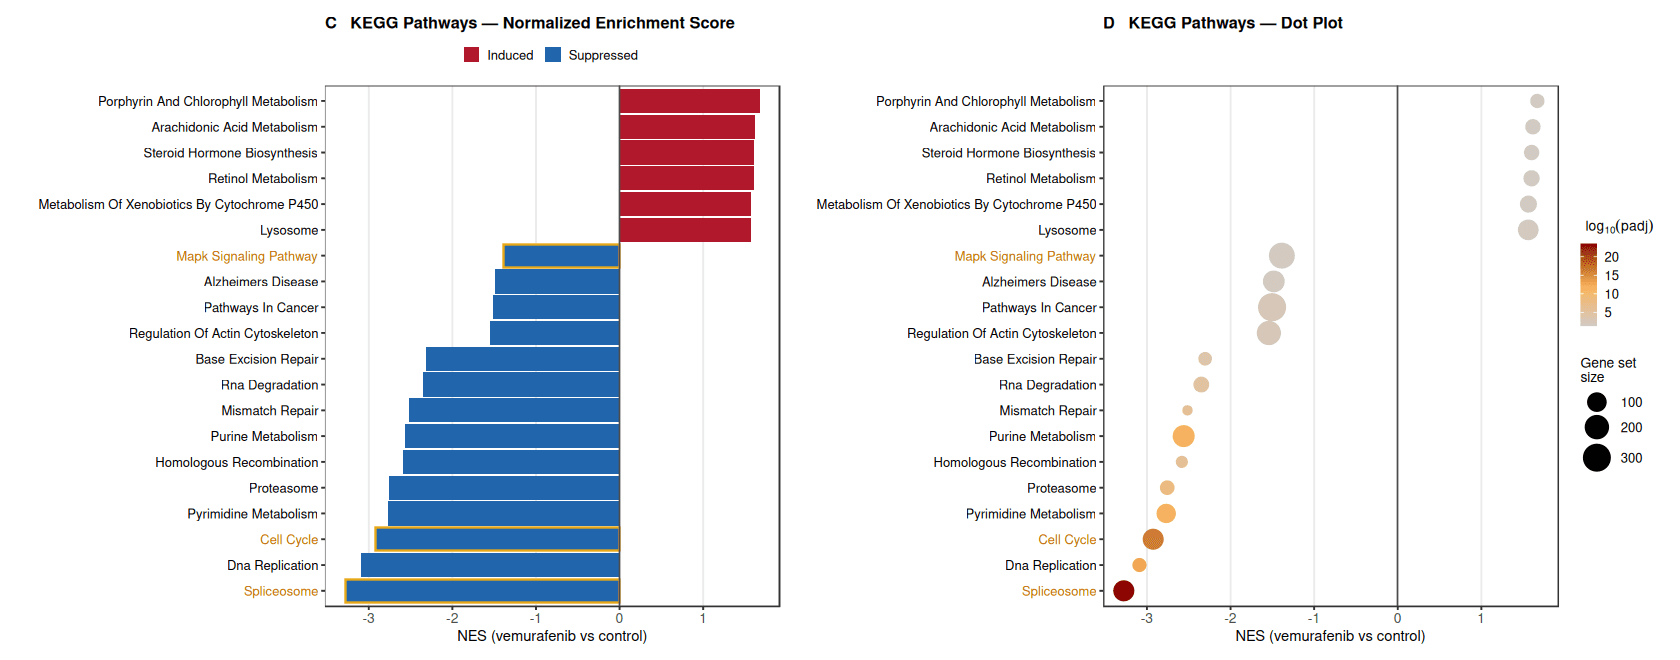
Consistent with these observations, pathway enrichment using the KEGG pathway database further showed strong suppression of core proliferative and biosynthetic processes. Gene sets associated with Cell Cycle, DNA Replication, Spliceosome, and Pyrimidine Metabolism displayed strongly negative normalized enrichment scores, suggesting inhibition of DNA synthesis and cell-cycle progression.
In contrast, several metabolic pathways, including Retinol Metabolism, Steroid Hormone Biosynthesis, and Xenobiotic Metabolism by Cytochrome P450, were relatively enriched among genes induced by treatment.
Together, these results indicate that vemurafenib triggers a coordinated transcriptional program characterized by suppression of cell-cycle and MYC-driven proliferation together with activation of stress and inflammatory signaling pathways. This global transcriptional rewiring is consistent with the point where inhibition of ERK signaling leads to reduced proliferative output while promoting compensatory signaling programs that facilitate adaptive resistance.
Where Drylab confirmed the paper:
• FGFR1 and FGF2 enrichment in HTH104 and sw1736 (thyroid, SHP2-negative): confirmed quantitatively (tissue_diff = -1.93 and -1.92 respectively).
• ERBB3/AREG/EREG enrichment in WIDR (colorectal, SHP2-positive): confirmed (tissue_diff = +1.82, +1.77, +1.92), supporting the EGFR-axis dependency described in the paper.
• FGFR isoform switching — FGFR1 dominant in thyroid vs. FGFR3/4 in colorectal WIDR — was a new quantitative finding in the Drylab analysis that extends the paper's FGFR1 observation.
• DUSP6 and FOSL1 suppression upon vemurafenib: confirmed (top suppressed genes in ranked list, t = -7.88 and -8.26), providing an internal positive control for on-target ERK inhibition.
Hypothesis suggestions from Drylab
New Finding | Biological Significance |
|---|---|
EMT is the strongest tissue-split discriminator (NES = -3.86, padj = 6.5e-38 in thyroid ATC) | Not reported in the paper; consistent with established ATC biology; explains the dominant PC1 variance |
E2F Targets, MYC Targets V1/V2, G2M Checkpoint strongly suppressed by vemurafenib (NES -3.9 to-4.3) | Paper did not perform pathway-level analysis on the RNA-seq data; this is a full description of the downstream transcriptional consequences of BRAF inhibition |
Interferon Alpha/Gamma response induction by vemurafenib (NES +2.29, +2.00) | Immunomodulatory effect of MAPK inhibition, not discussed in the original paper; connects to clinical trial data (VEMUPLINT) |
Spliceosome suppression upon vemurafenib (NES = -3.28) | Plausibly secondary to MYC repression; not reported in original paper; flagged as requiring independent validation |
SOS1 transcriptional upregulation in sw1736 upon vemurafenib | Suggests transcriptional compensation at the RAS-GEF level in thyroid V600E cells |
NRG2 induction in V600E lines | Potential ERBB3-PI3K bypass axis; not described in the paper |
FGFR2 modest induction in V600E lines | Additional FGFR paralog compensation |
KEGG Cell Cycle enrichment correctly assigned to thyroid ATC (NES = -2.74), not WIDR | Resolved a potential reviewer misattribution; biologically coherent given ATC's extreme mitotic index |