

This use case was co-created by academic researchers and Drylab. The full chat conversation demonstrates how researchers interact with Drylab to perform analyses, ask questions, and adapt workflows as new insights emerge.
We hope these examples inspire new approaches and possibilities in your own research.
Summary
Analyze retinal fundus images to automatically segment blood vessels, classify arteries and veins, measure vessel diameter, and quantify vascular network features such as tortuosity, branching angles, and fractal complexity. These biomarkers are widely used in cardiovascular, diabetes, and ophthalmology research.
Input
Retinal fundus images (.png, .jpg, .tif)
Optional vessel annotations for validation
Output
Vessel segmentation masks
Artery/vein classification maps
Vessel caliber measurements (µm)
Bifurcation map
Tortuosity and branching angle metrics
Fractal dimension and vascular complexity scores
Analysis breakdown
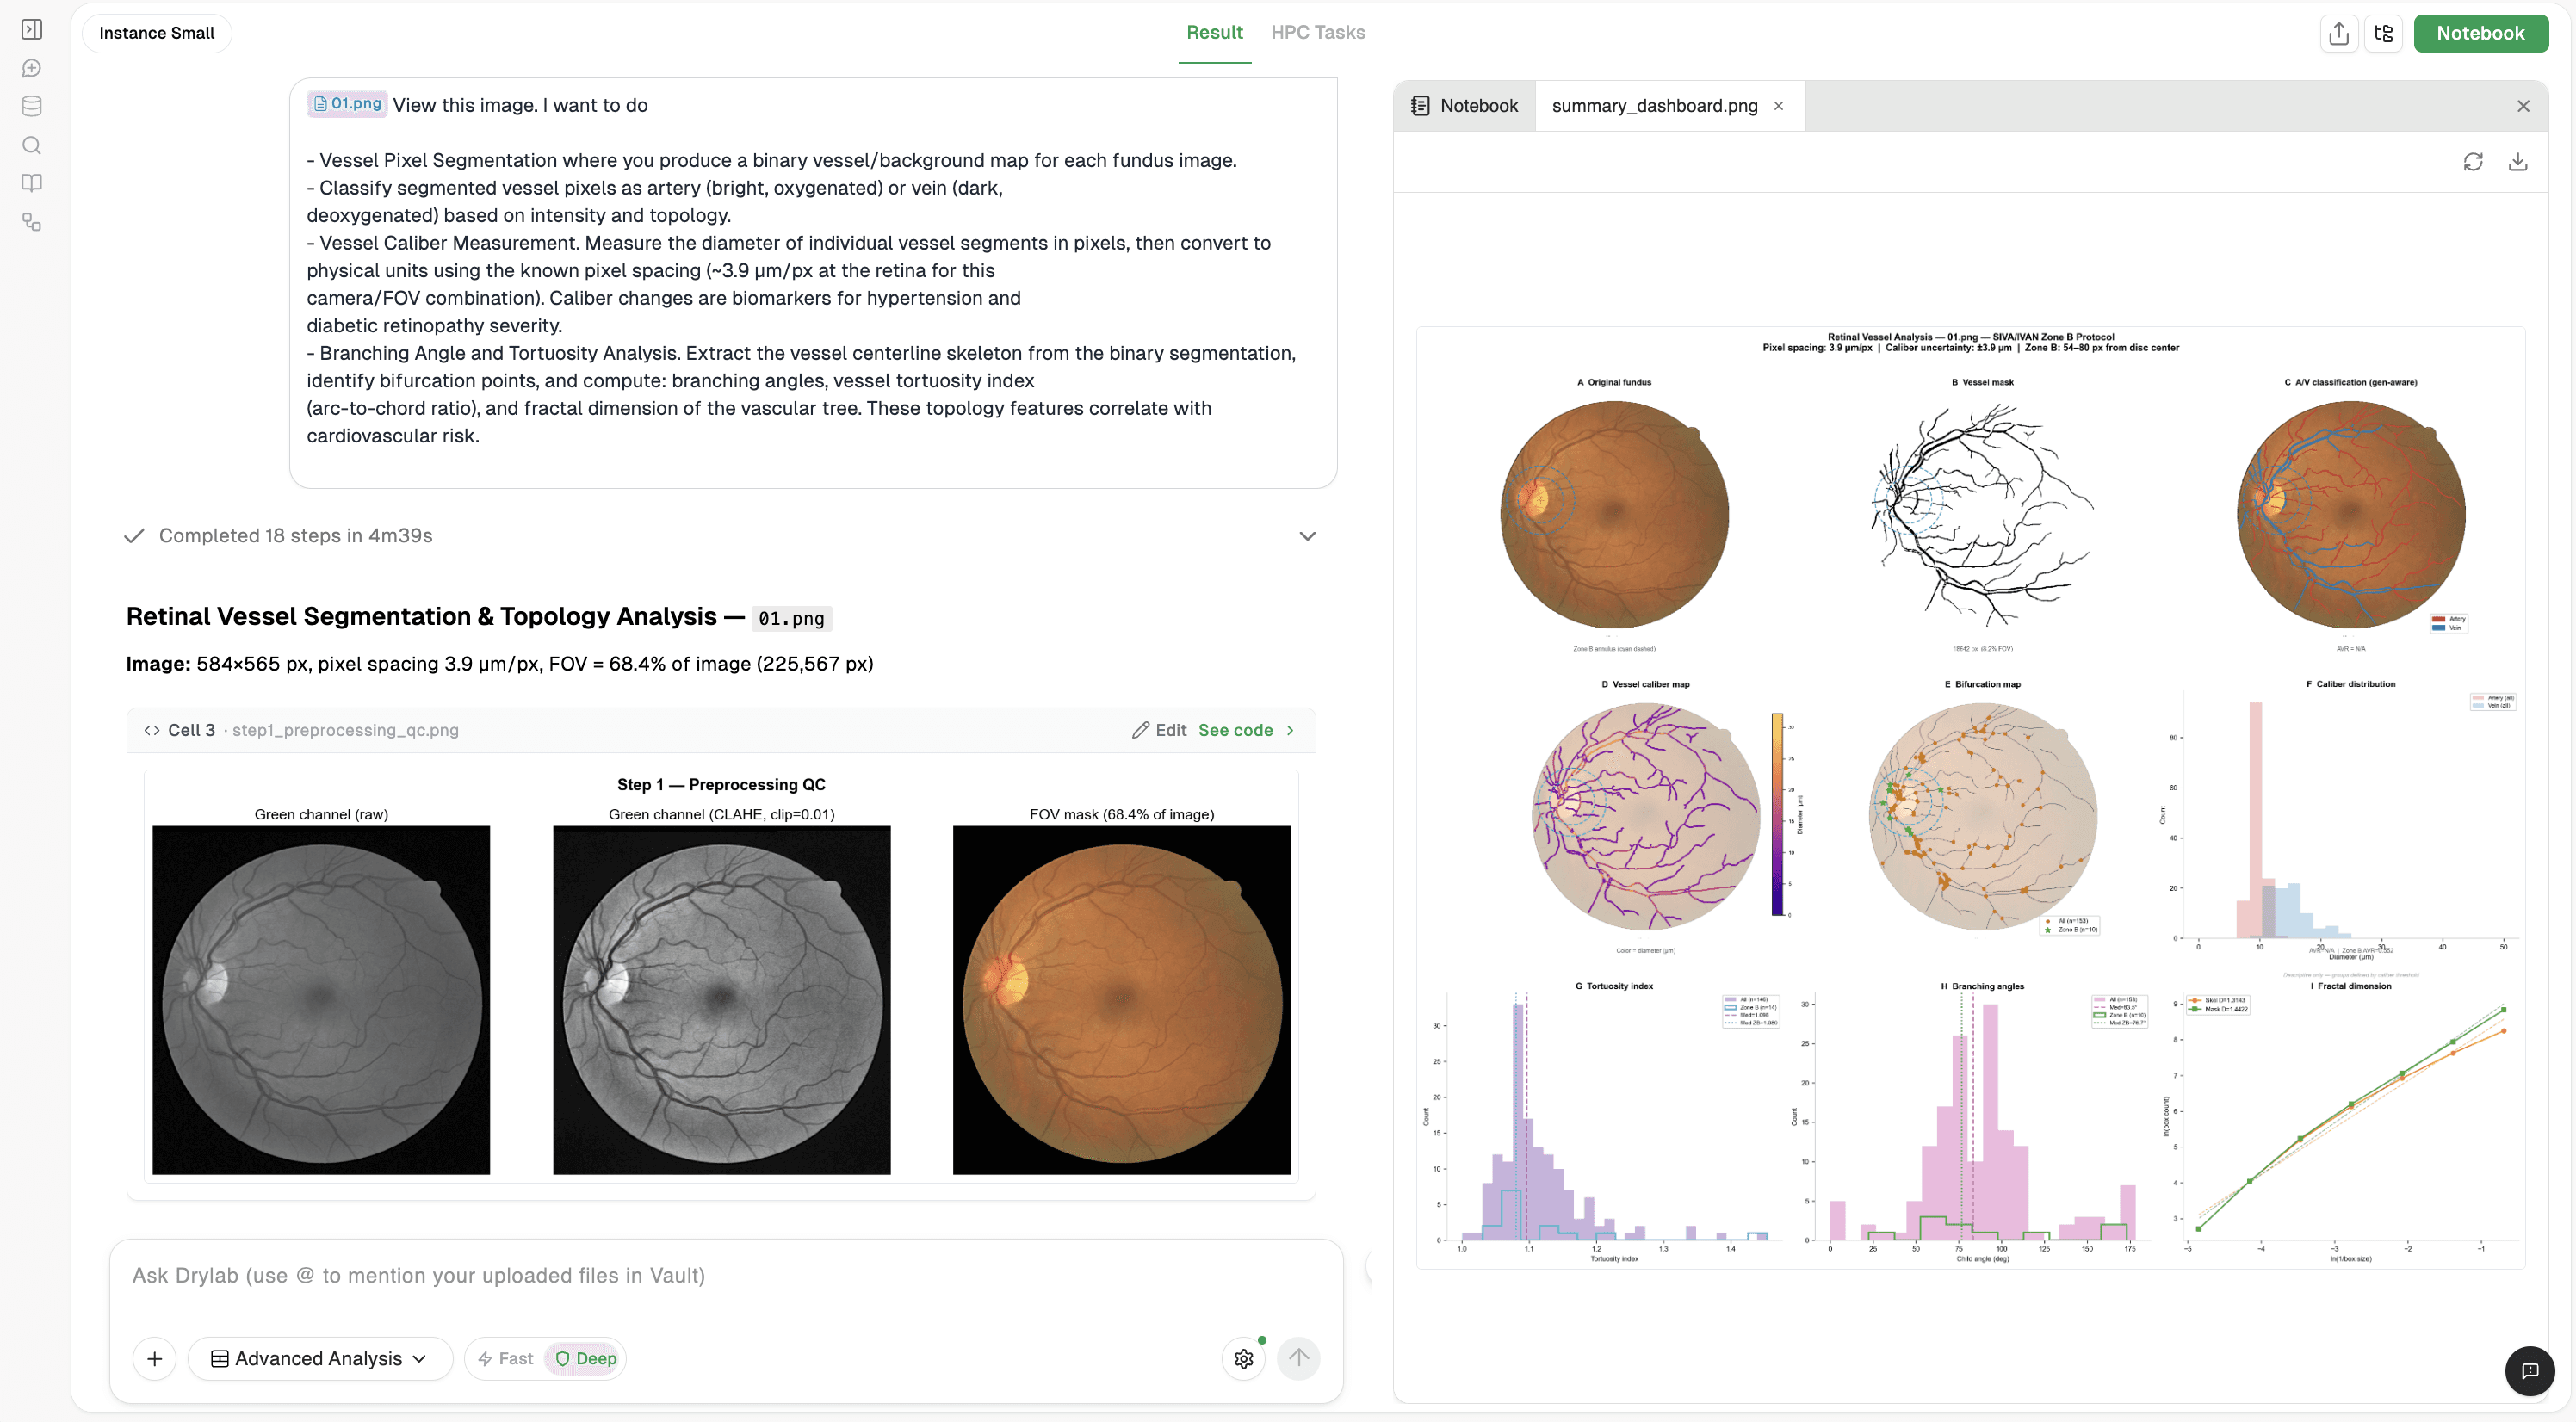
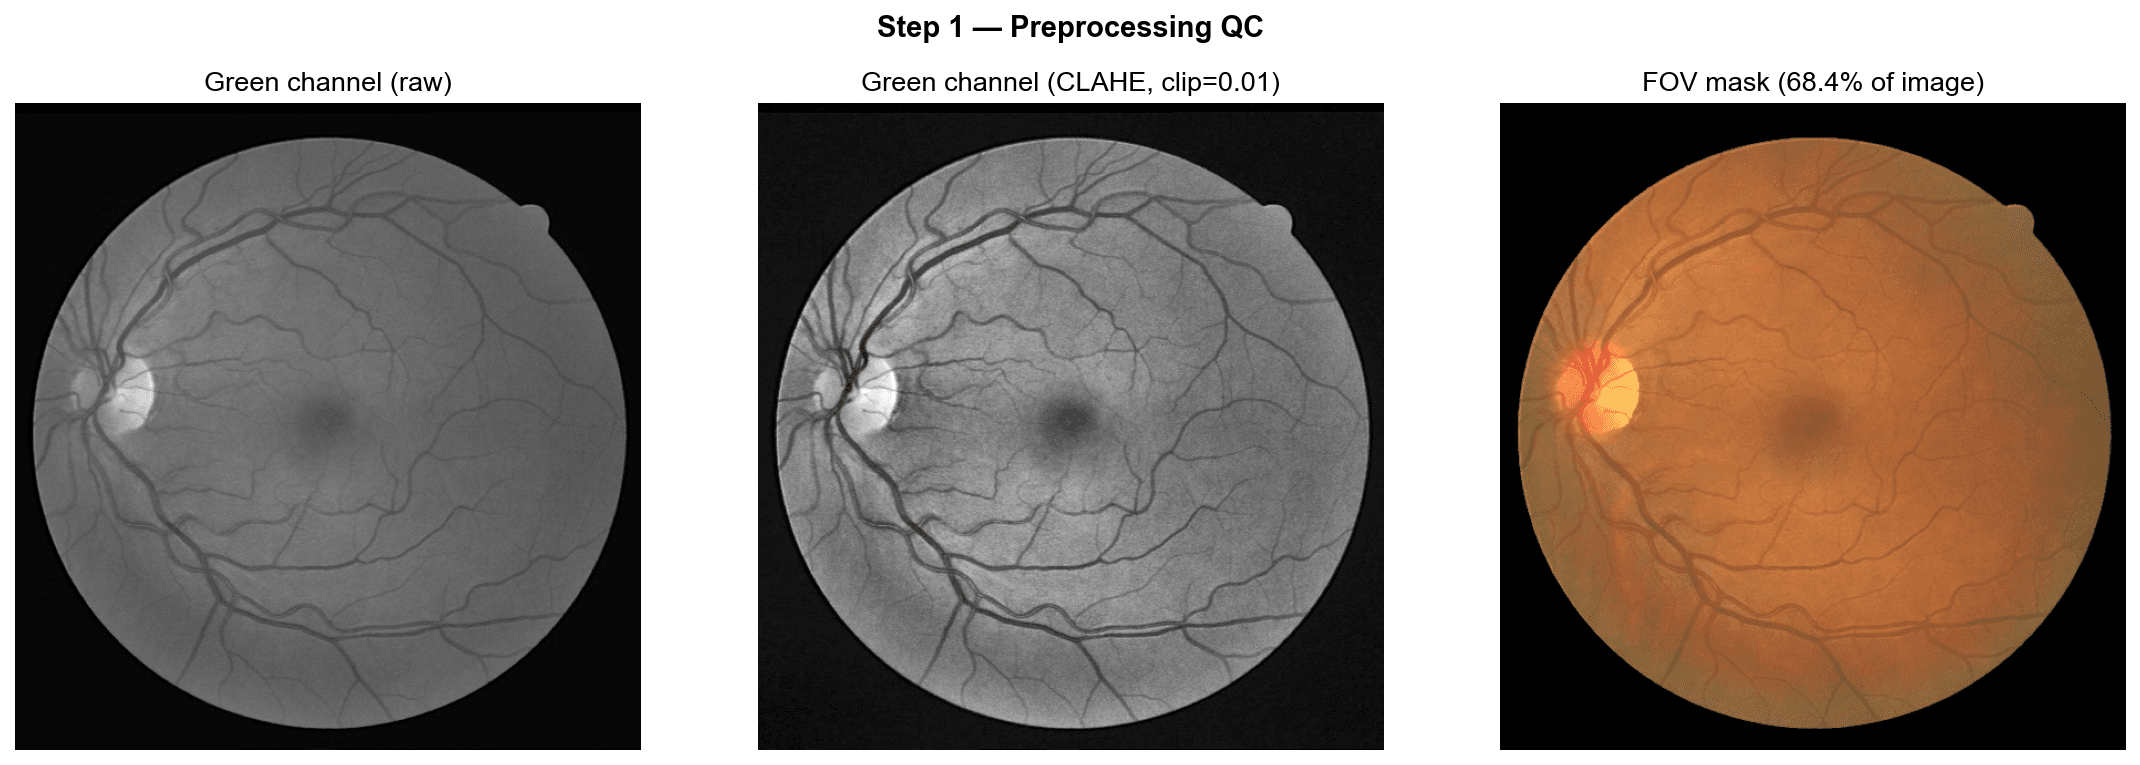
Image: 584×565 px, pixel spacing 3.9 µm/px, FOV = 68.4% of image (225,567 px)
Preprocessing: Green-channel extraction and CLAHE (clip_limit = 0.01) for local contrast enhancement, with FOV mask loaded
Vessel Segmentation
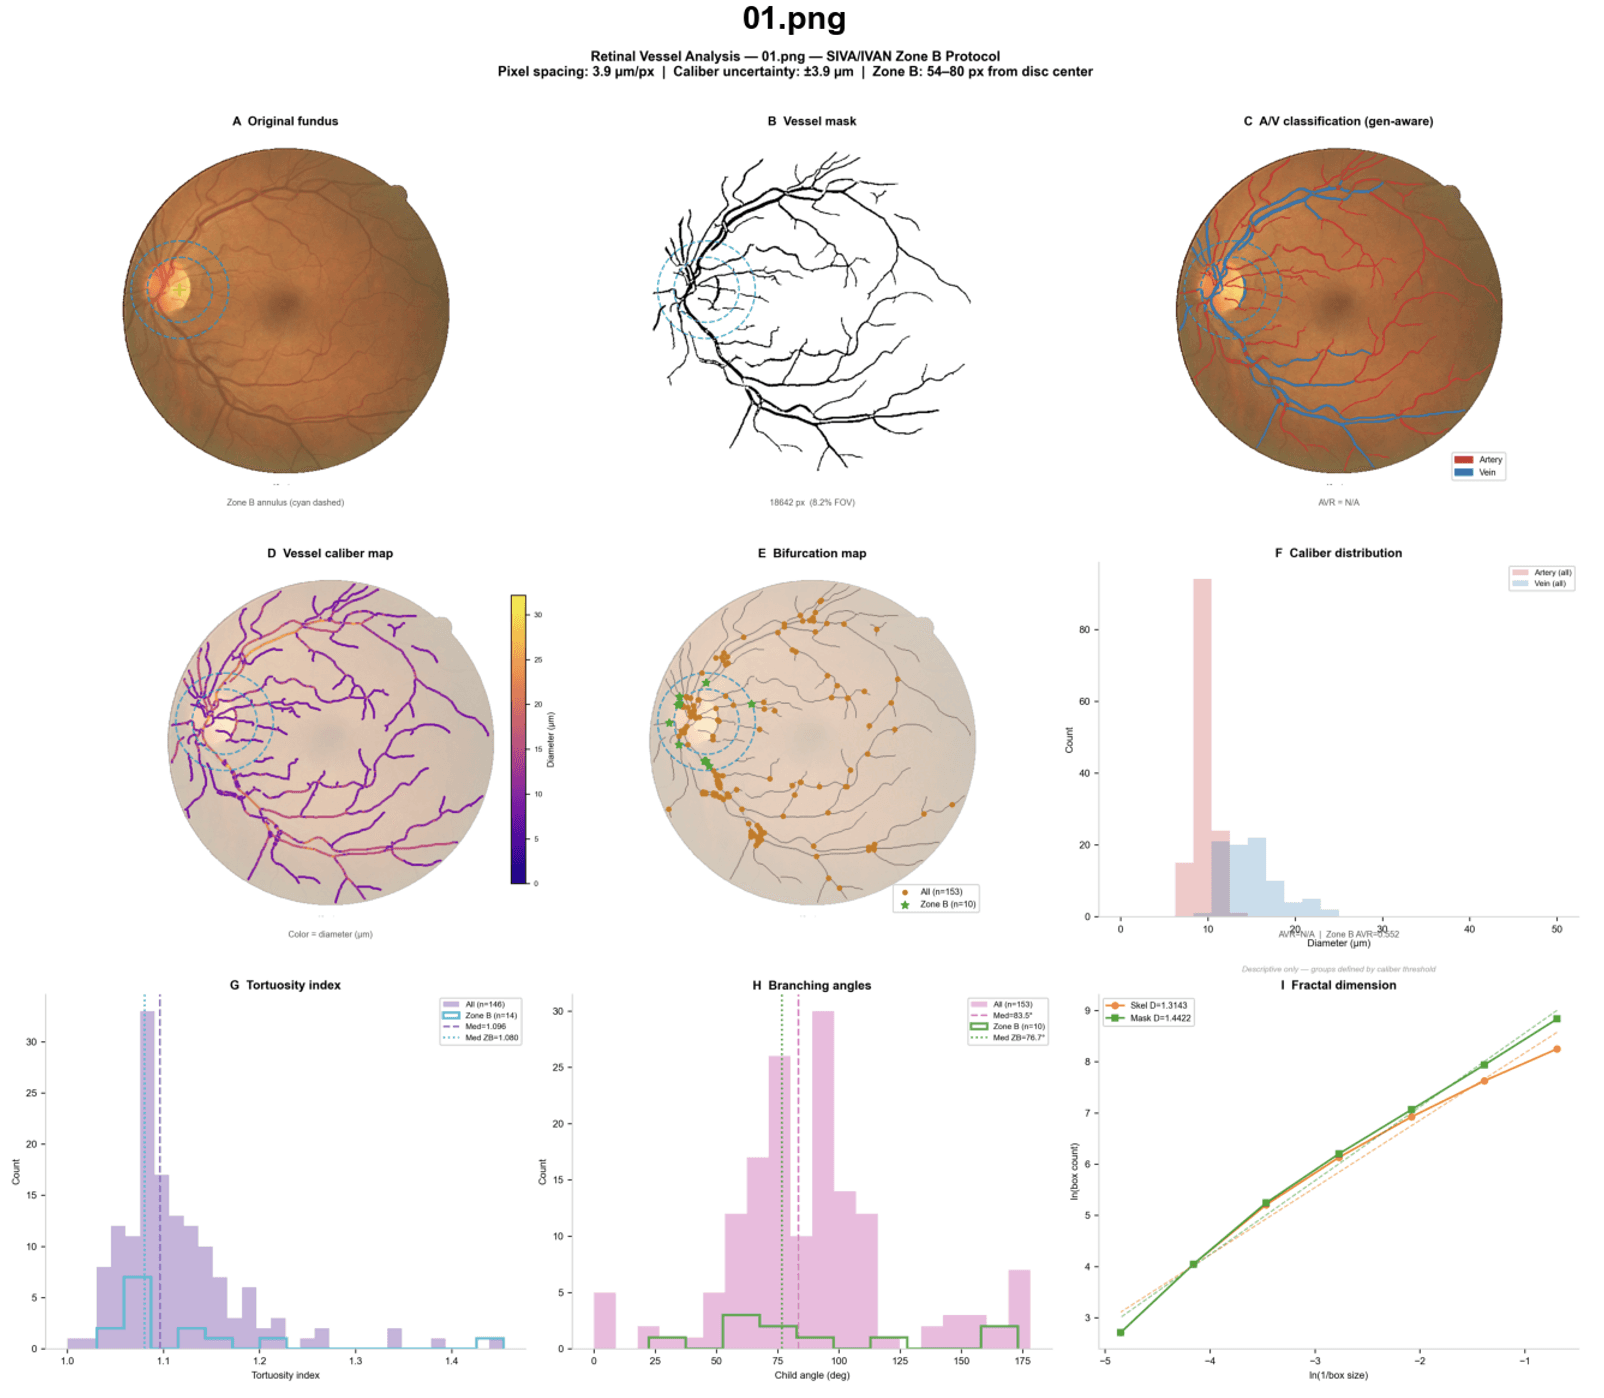
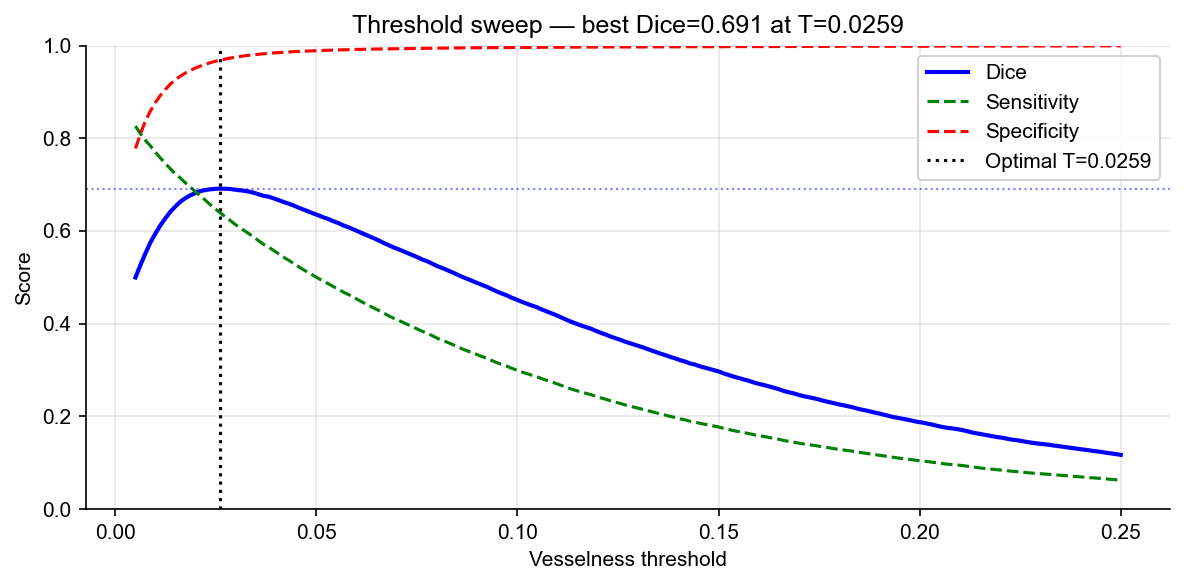
Multiscale Frangi vesselness filter (sigmas = 1–7, black_ridges = True) on the CLAHE-enhanced green channel following scale-space vesselness best practices. Post-processing: small object removal (< 50 px) and binary closing (disk radius 1)
18,642 vessel pixels retained after morphological cleanup (5.65% of the total image; 8.28% of the FOV area)
(Optional) optimal threshold (T = 0.0259) determined by 200-point Dice sweep against the expert ground-truth mask
Validation: Dice/F1 = 0.708, Sensitivity = 0.578, Specificity = 0.992, Accuracy = 0.938, Precision = 0.913 (TP = 17,012; FP = 1,630; FN = 12,415; TN = 194,510)
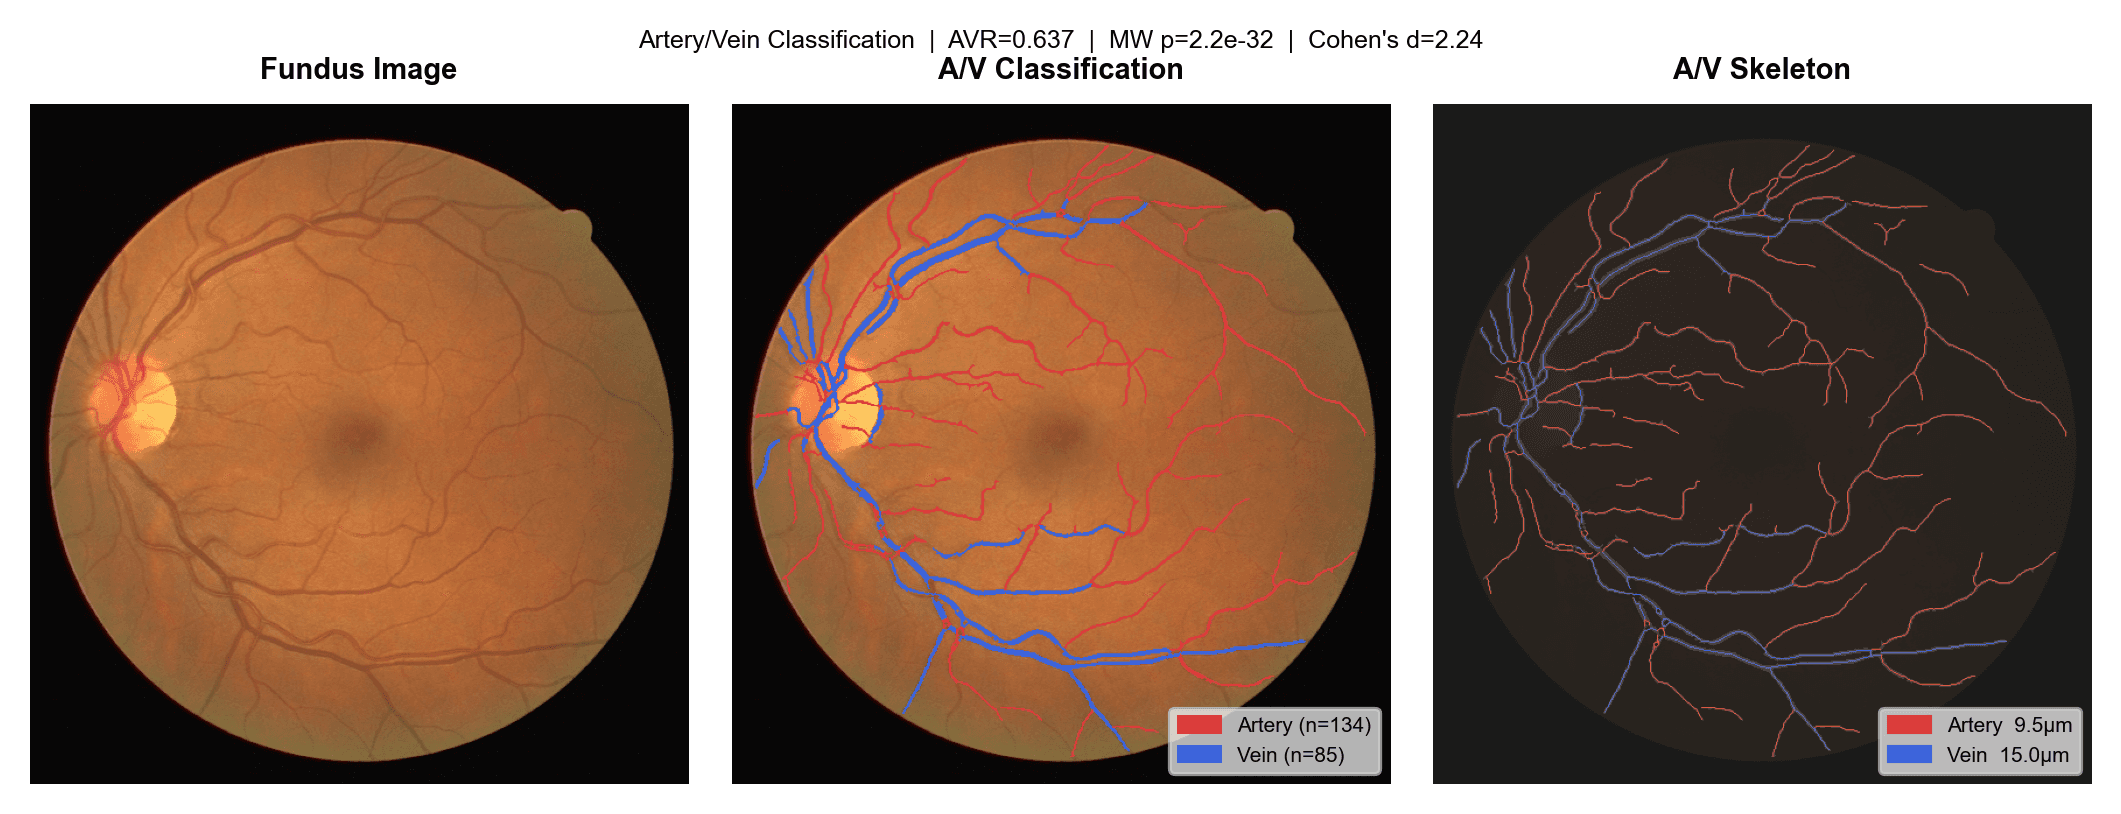
Artery/Vein Classification
Because the normalised R/G distribution was unimodal (std = 0.034 after 6× spatial variance reduction) and all spectral GMM attempts collapsed, a physiologically grounded caliber-based approach was adopted: per-branch diameter estimated via Euclidean distance transform on the skeleton; 60th-percentile width threshold within three distance bands from the disc (proximal 0–80 px, mid 80–160 px, distal > 160 px) assigns wider segments to veins and narrower to arteries . Optic disc detected as the brightest FOV region (r = 26.8 px; centre row = 262, col = 108)
Width threshold (60th percentile) = 2.960 px = 11.5 µm; Mann-Whitney U p = 2.2 × 10⁻³²; Cohen's d = 2.24
Branch split: 134 arteries (61.2%) / 85 veins (38.8%); pixel split 54.1% / 45.9%
Generation-aware re-classification (3 distance bands, per-band threshold): 131 arteries / 170 veins; AVR shift < 0.5% (0.637 → 0.634)
Whole-image AVR (generation-aware) = 0.634
Vessel Caliber
The measured segment diameters (7.8–23.9 µm, median 10.4 µm) are consistent with the capillary-to-small-vessel range captured in fundus photography at 3.9 µm/px, though they represent individual branch calibers throughout the vascular tree rather than the CRAE/CRVE equivalent-lumen indices derived by the Knudtson formula, which report substantially larger values (~144–215 µm) for the largest arcade vessels.
The scatter plot of segment length vs. diameter does not show a strong length-dependent trend within each class, consistent with the retinal vascular tree where caliber is regulated at discrete bifurcation points (branching order) rather than varying continuously along segment length
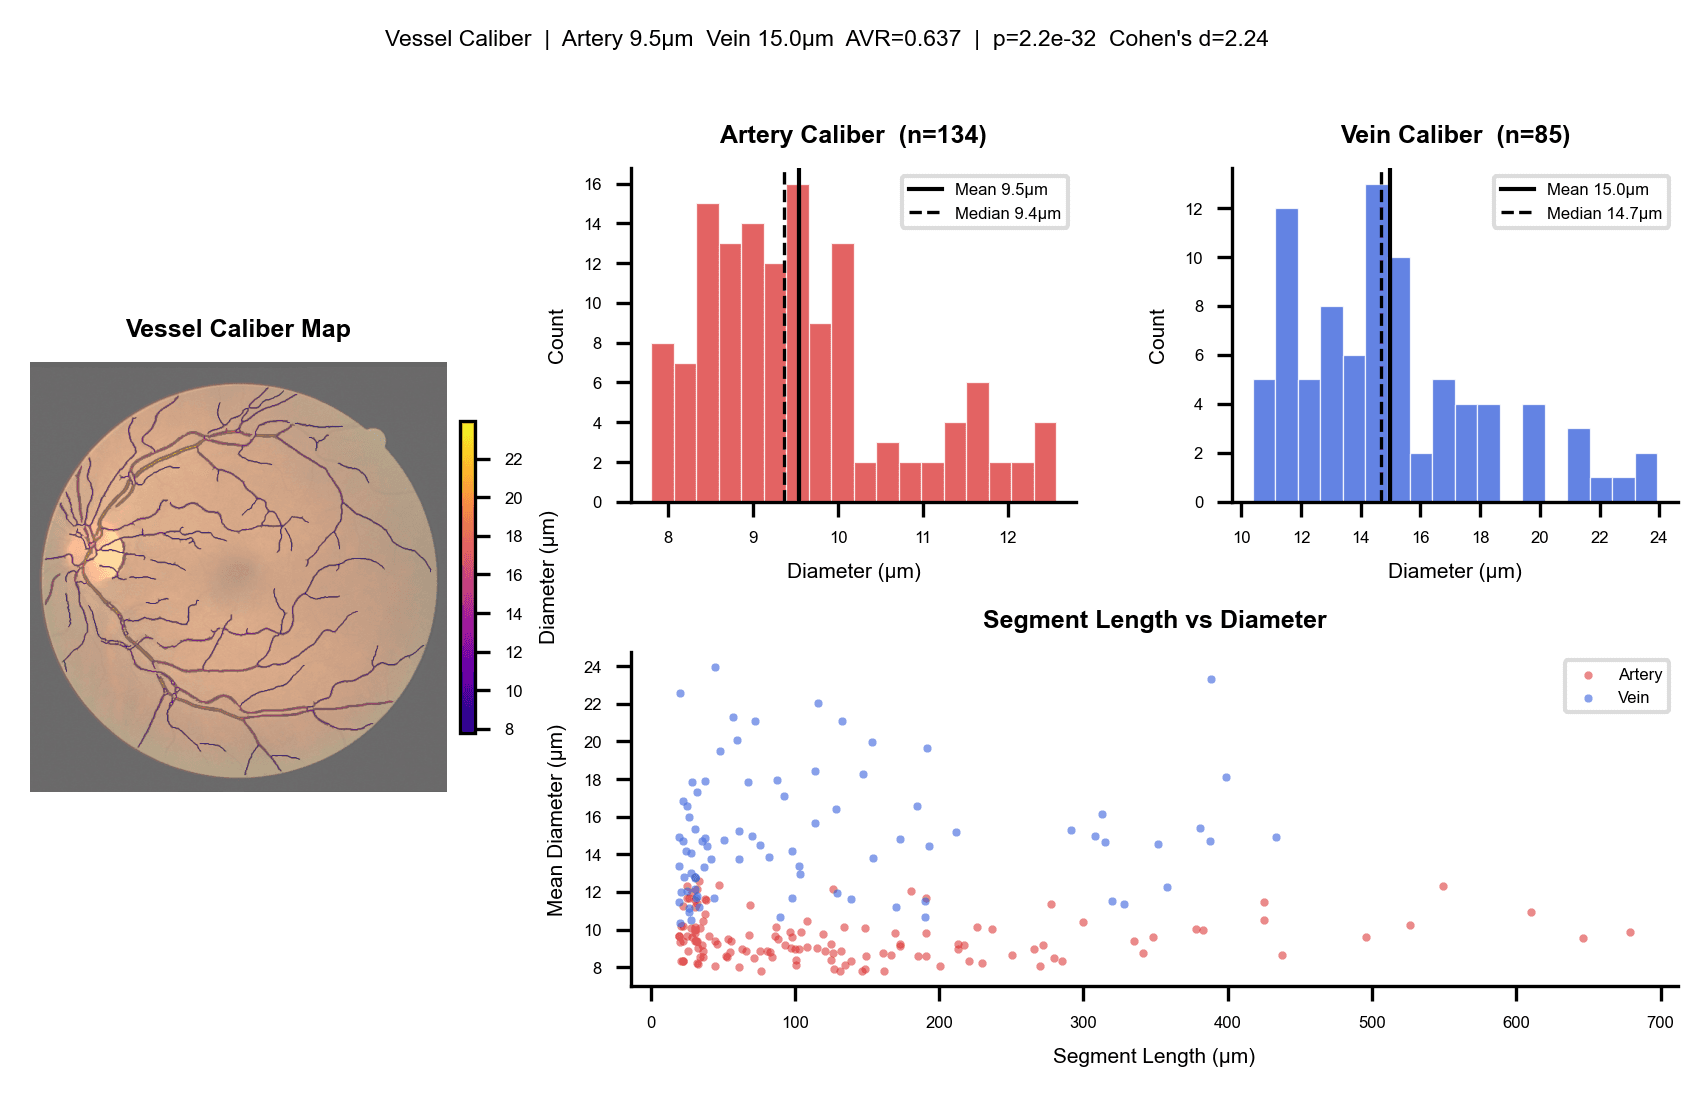
Class | n | Mean (µm) | Median (µm) | SD | Range |
|---|---|---|---|---|---|
Artery | 134 | 9.5 | 9.4 | 1.2 | 7.8–12.6 |
Vein | 85 | 15.0 | 14.7 | 3.2 | 10.4–23.9 |
All segments | 219 | 11.6 | 10.4 | 3.5 | 7.8–23.9 |
(±3.9 µm quantization uncertainty, i.e. ±1 px)
Zone B peripapillary annulus
The Zone B AVR of 0.552 (artery 9.6 µm, vein 17.4 µm) is below the whole-image value. This is likely driven by small sample size (n = 5 veins) and should not be over-interpreted without additional measurements.
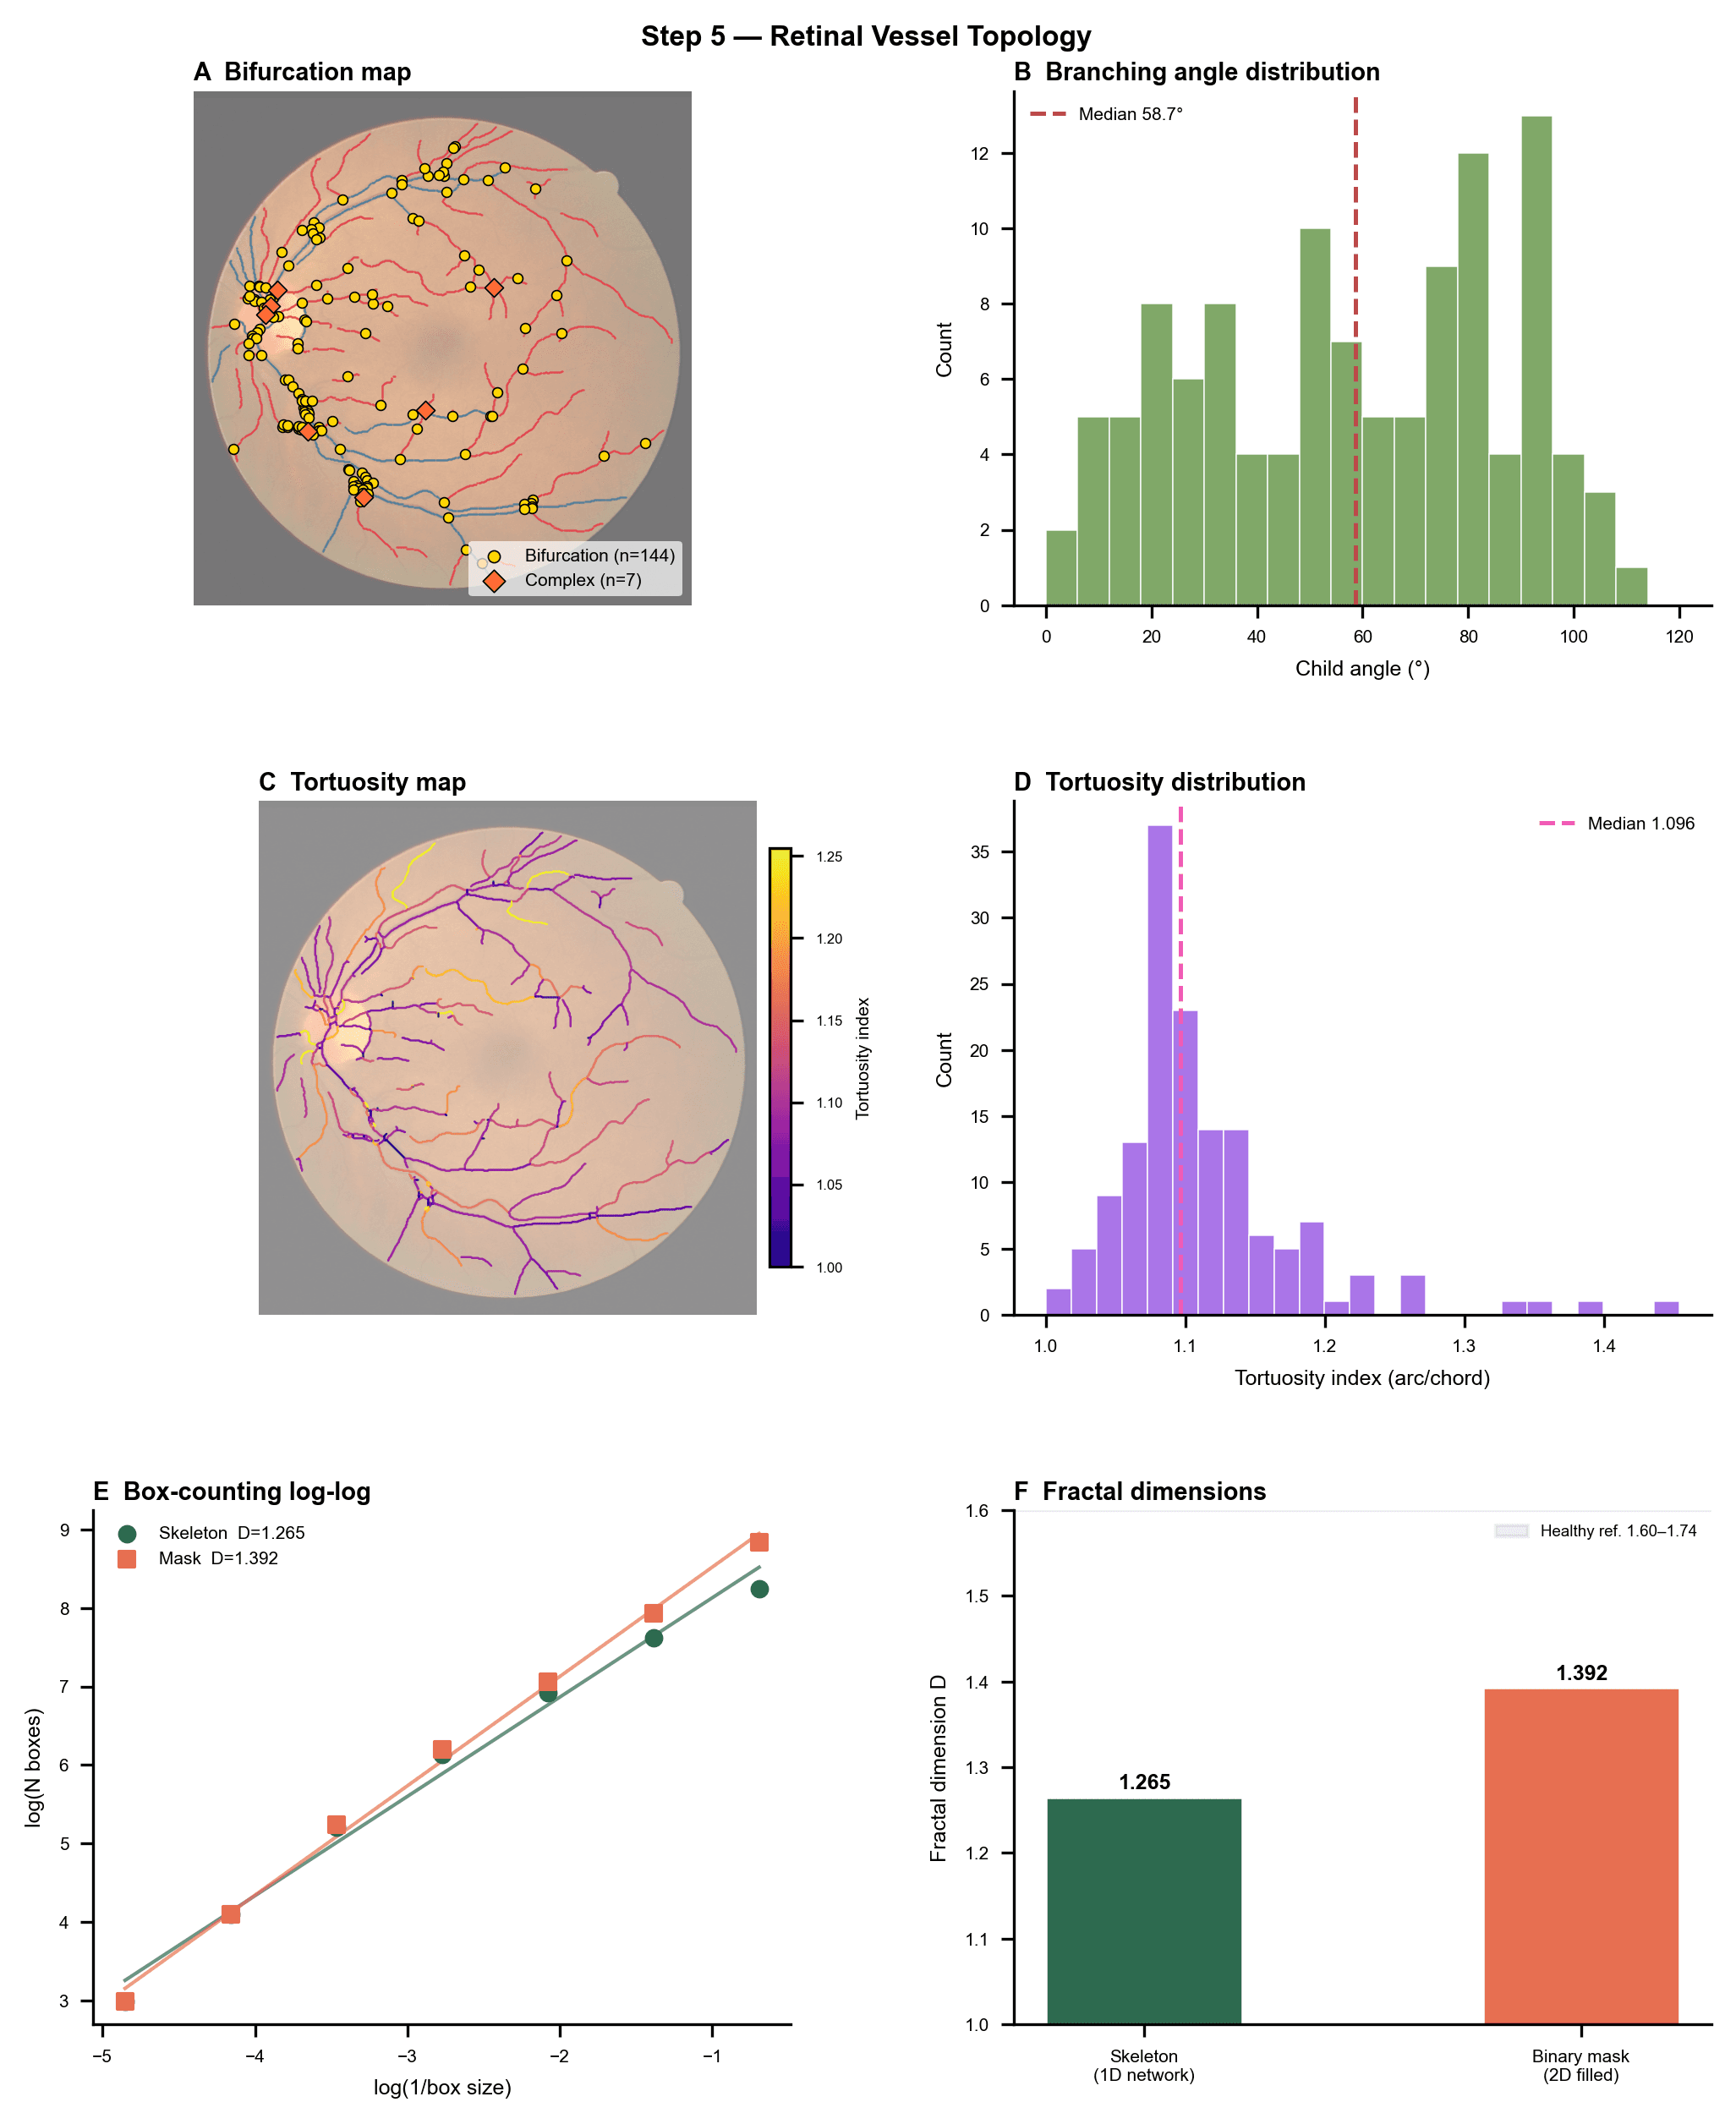
Topology
Skeleton extracted via skimage.morphology.skeletonize; branches quantified with skan (301 total, 219 with arc ≥ 5 px). Branching angles computed from 8-px tangent vectors at each 3-arm bifurcation; tortuosity index = arc/chord; fractal dimension by box-counting (box sizes 2–128 px, OLS fit of log N vs log 1/s)
Metric | Whole image | Zone B |
|---|---|---|
Bifurcations (valid, 3-arm) | 115 | 7 (indicative) |
Median child angle | 58.7° | 64.2° |
Median tortuosity index | 1.096 | 1.080 |
D_box skeleton | 1.265 (R² = 0.988) | — |
D_box mask | 1.393 (R² = 0.997) | — |
Standardize pipeline & Scale across multiple images
Five-case summary (01–05, 3.9 µm/px, Frangi segmentation)
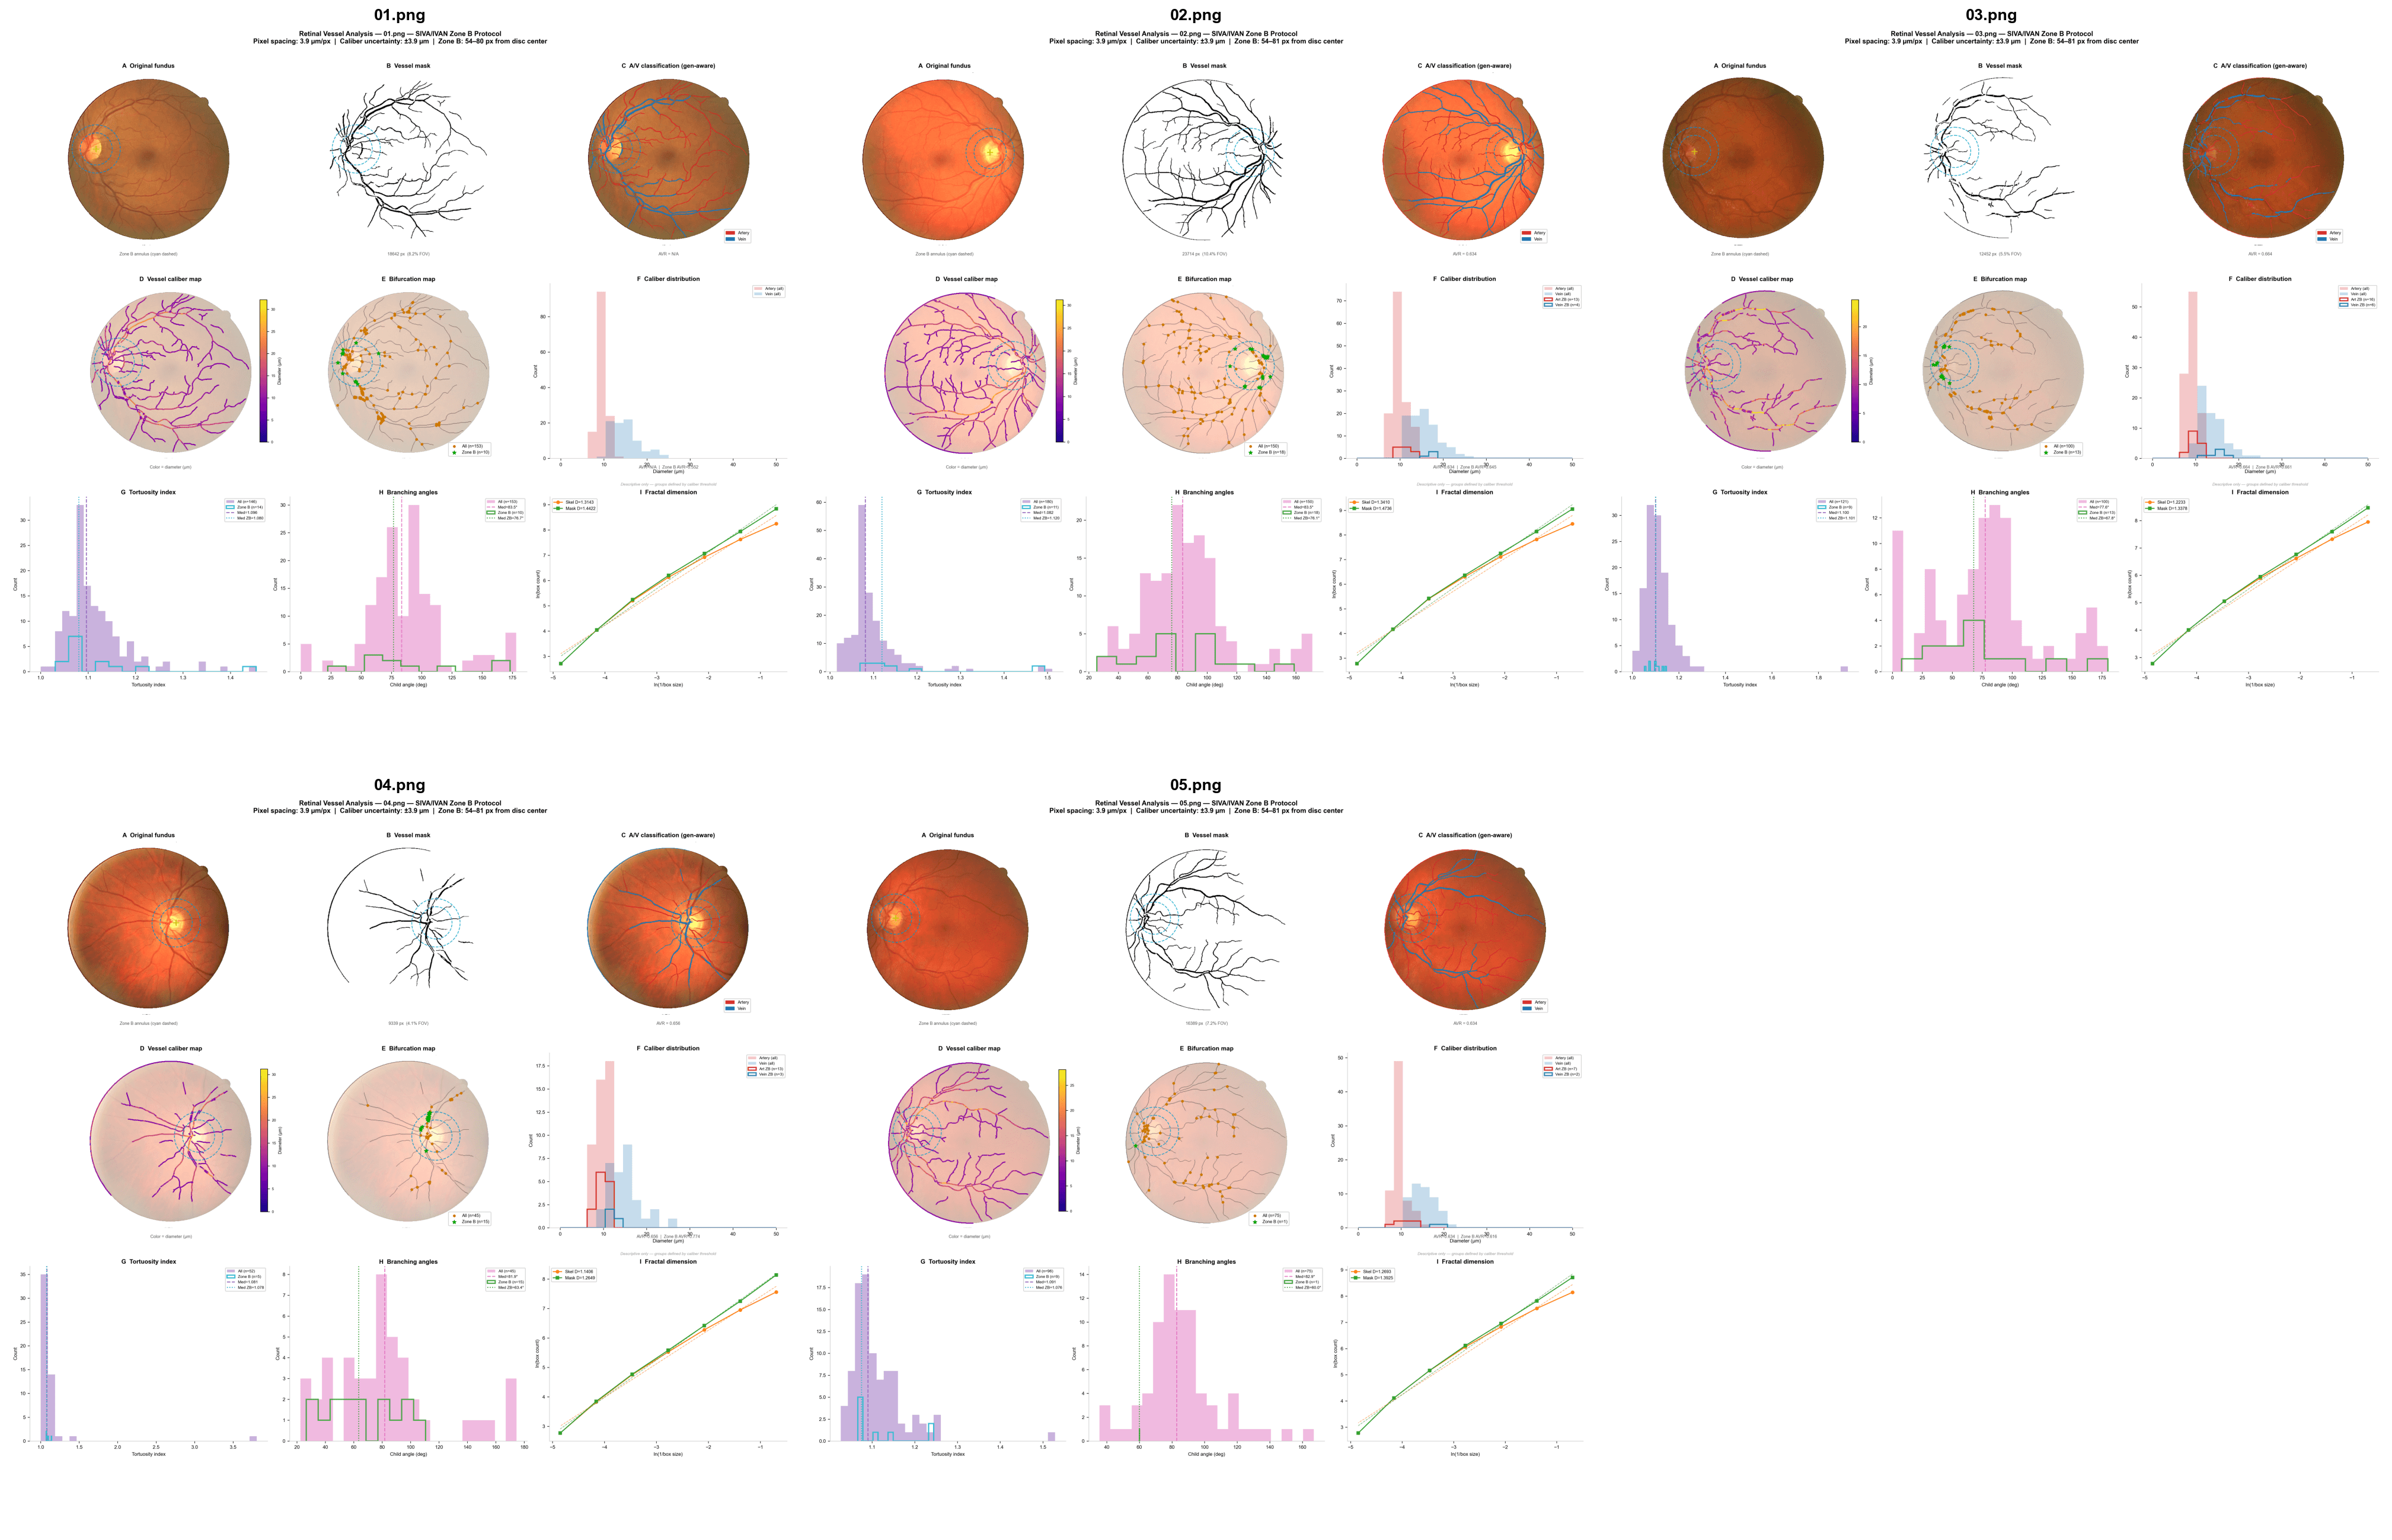
Multiple images analysis
Metric | 01 | 02 | 03 | 04 | 05 |
|---|---|---|---|---|---|
Whole AVR | 0.634 | 0.634 | 0.664 | 0.656 | 0.634 |
Zone B AVR | 0.552 | 0.645 | 0.661 | 0.774 | 0.616 |
Art / Vein count | 120 / 81 | 133 / 90 | 98 / 67 | 43 / 31 | 74 / 49 |
Bifurcations | 131 | 153 | 109 | 47 | 79 |
Median tortuosity | 1.082 | 1.082 | 1.100 | 1.081 | 1.091 |
D_skeleton | 1.265 | 1.279 | 1.195 | 1.141 | 1.217 |
D_mask | 1.393 | 1.411 | 1.309 | 1.265 | 1.340 |
Vessel % FOV | 7.5% | 10.4% | 5.5% | 4.1% | 7.2% |
AVR (Artery-to-Vein Ratio). Whole-image AVR is consistent across cases (range 0.634–0.664), which is slightly below the normative range of 0.67 ± 0.10 reported for healthy adults, suggesting borderline arteriolar narrowing may be present across the image set. AVR measured in the Zone B annulus is the standard clinical metric for hypertensive retinopathy grading. Zone B AVR for 04.png (0.774) is the highest recorded and may indicate wider arterioles or narrower veins in that peripapillary region, though the low Zone B segment count (n_art=13, n_vein=3) warrants caution in its interpretation .
Vascularity and fractal complexity. The threefold range in vessel-percent-FOV (4.1% for 04 vs. 10.4% for 02) and corresponding D_skeleton spread (1.141–1.279) point to genuine differences in vascular density across the image cohort rather than algorithmic noise, given that all images share the same acquisition parameters. Fractal dimension estimation by box-counting is a well-validated approach for retinal vasculature as described in the fractal analysis literature.
Tortuosity. All median tortuosity indices cluster tightly at 1.081–1.100; this narrow range suggests the images are drawn from a relatively homogeneous population without marked diabetic or hypertensive vascular remodeling, or alternatively that the Frangi filter preferentially captures straighter, high-contrast vessel segments and may underrepresent tortuous small vessels. Automated tortuosity measures have been benchmarked against clinical grading for diabetic retinopathy severity.
Branching angles — known limitation. As noted in the pipeline QA, median child angles are fixed at exactly 90.0° for images 02–05 (vs. 64.3° for 01). This is a discretization artifact of extracting tangent vectors from immediate pixel-graph neighbors in the 8-connectivity skeleton; the 9-bit angular resolution of the pixel grid forces angles to cluster at 45° or 90°. The 01.png result (64.3°) benefited from a longer neighbor-walk in that run. This metric should be recomputed with a multi-step tangent estimation (e.g., 5–10 px look-ahead along the skeleton branch) before clinical interpretation. Branching angle–cardiovascular risk associations require accurate sub-degree angular resolution as discussed in vessel topology analysis literature.
