This use case was co-created by academic researchers and Drylab. The full chat conversation demonstrates how researchers interact with Drylab to perform analyses, ask questions, and adapt workflows as new insights emerge.
We hope these examples inspire new approaches and possibilities in your own research.
Summary
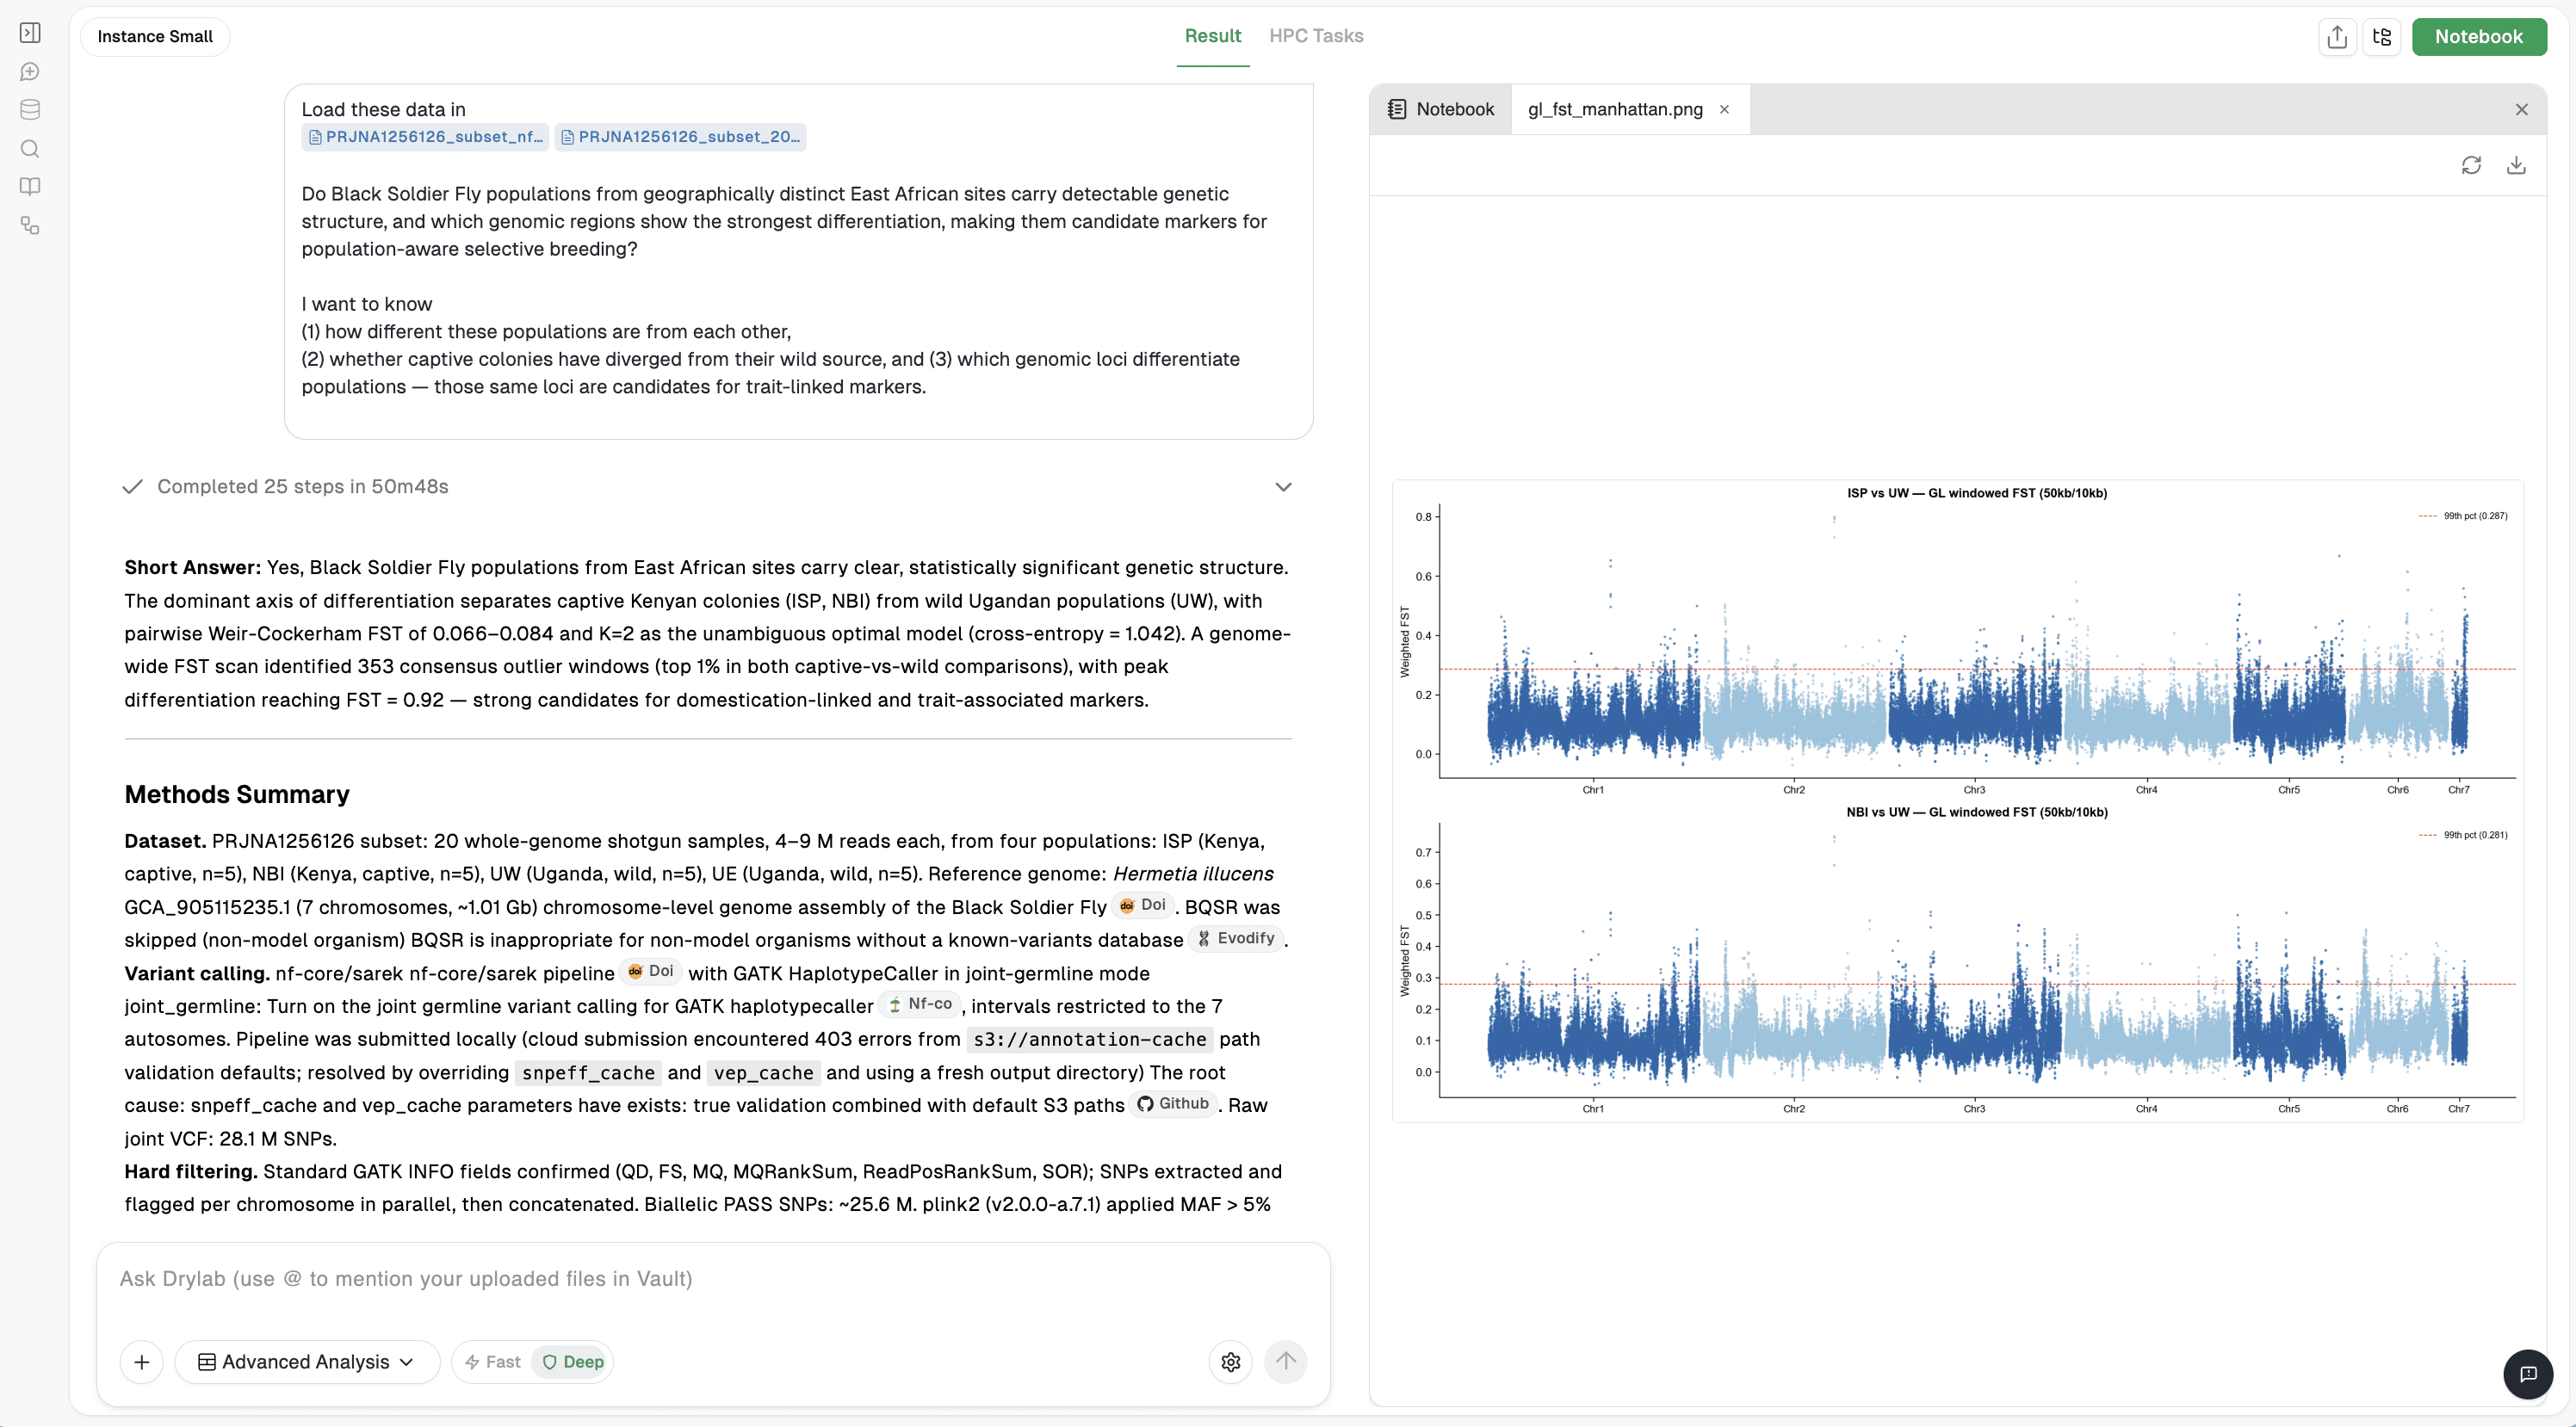
Analyze whole-genome sequencing data to quantify genetic structure between populations, assess divergence between captive and wild populations, and identify genomic regions under selection. This workflow helps explain these questions
(1) How different these populations are from each other
(2) Which genomic loci differentiate populations — those same loci are candidates for trait-linked markers.
Input
whole-genome sequencing data ( ~1× coverage whole-genome sequencing per sample
4 populations:
ISP (Industrial colony, Kenya)
NBI (Industrial colony, Kenya)
UW (Wild population, Western Uganda)
UE (Wild population, Eastern Uganda)
Over 4.5 million SNPs initially identified
Output
Quality control and contamination detection
Population structure analysis (PCA)
Admixture analysis
Genetic differentiation (FST)
Selective sweep detection
Cross-validation between traditional hard-call methods and genotype-likelihood (GL) approaches
Generate final report automatically
Key Biological Conclusions
1. Industrial colonies are diverging from wild populations
Captive-vs-wild differentiation reached:
ISP vs UW: FST = 0.113
NBI vs UW: FST = 0.106
2. A major domestication candidate locus was discovered
The strongest selection signal was identified on:
Chromosome 2 (~137.35 Mb), with:
FST = 0.801 (ISP vs UW)
FST = 0.753 (NBI vs UW)
Importantly, this signal appeared independently in both commercial colonies, suggesting a shared adaptive response during industrial breeding.
3. Additional candidate selection regions identified
Secondary candidate: Chromosome 5 (~77.9 Mb)
Potential tertiary candidate: Chromosome 3 (~173.5 Mb)
These regions may contain genes associated with traits such as growth, feed conversion efficiency, environmental adaptation, or production performance.
Analysis breakdown
Dataset: PRJNA1256126 subset: 20 whole-genome shotgun samples, 4–9 M reads each, from four populations: ISP (Kenya, captive, n=5), NBI (Kenya, captive, n=5), UW (Uganda, wild, n=5), UE (Uganda, wild, n=5). Reference genome: Hermetia illucens GCA_905115235.1 (7 chromosomes, ~1.01 Gb) chromosome-level genome assembly of the Black Soldier Fly. BQSR was skipped (non-model organism) BQSR is inappropriate for non-model organisms without a known-variants database
Raw data processing
Variant calling. nf-core/sarek nf-core/sarek pipeline with GATK HaplotypeCaller in joint-germline mode joint_germline: Turn on the joint germline variant calling for GATK haplotypecaller, intervals restricted to the 7 autosomes. Pipeline was submitted locally
Hard filtering. Standard GATK INFO fields confirmed (QD, FS, MQ, MQRankSum, ReadPosRankSum, SOR); SNPs extracted and flagged per chromosome in parallel, then concatenated. Biallelic PASS SNPs: ~25.6 M. plink2 (v2.0.0-a.7.1) applied MAF > 5% and --geno 0.50 (max 50% missing, the minimum viable threshold given ~1× coverage in this downsampled proof-of-concept dataset); 1,681,501 SNPs retained .
Sample QC
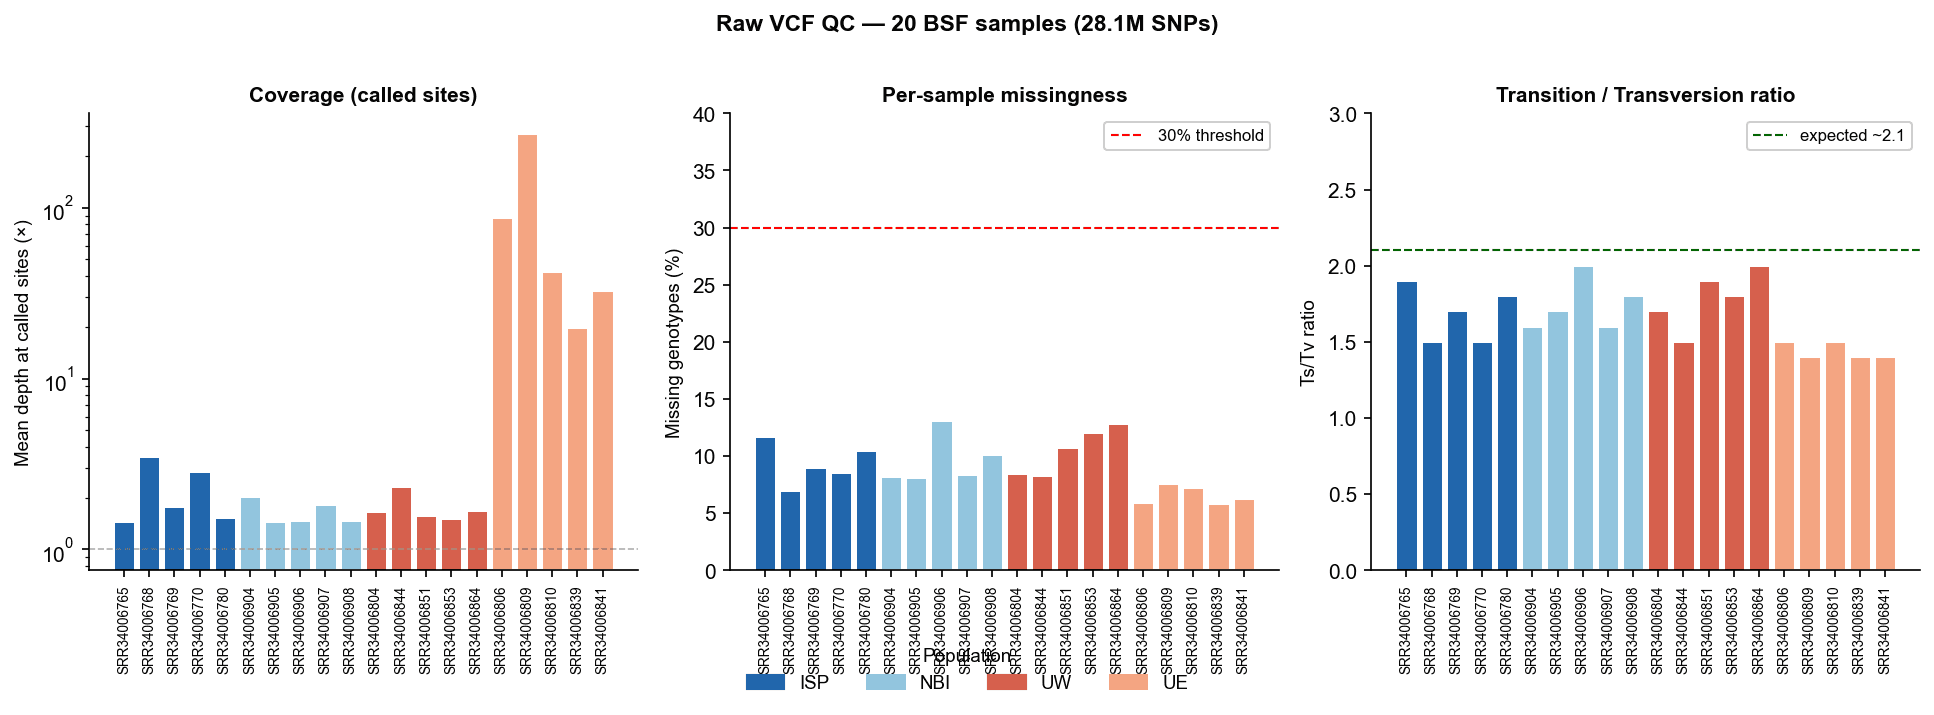
All 20 samples passed per-sample missingness QC (6–13%, all well below the 30% exclusion threshold) .
Ts/Tv ratios ranged 1.4–2.0 across samples. This is slightly below the ~2.1 mammalian expectation, but insect genomes also natively produce lower Ts/Tv than mammalian genomes.
Five samples (all UE + two UW) showed severely low mapping rates (9–26%), while 12/20 samples mapped at >90% . The extreme per-site depth disparity in UE (20–270× at called sites vs ~1–3.5× in other populations) reflects concentration of the few mapped reads at a small subset of accessible sites — a pattern consistent with high microbiome/environmental DNA content in field-collected larval specimens.
Hard-Call Population Structure
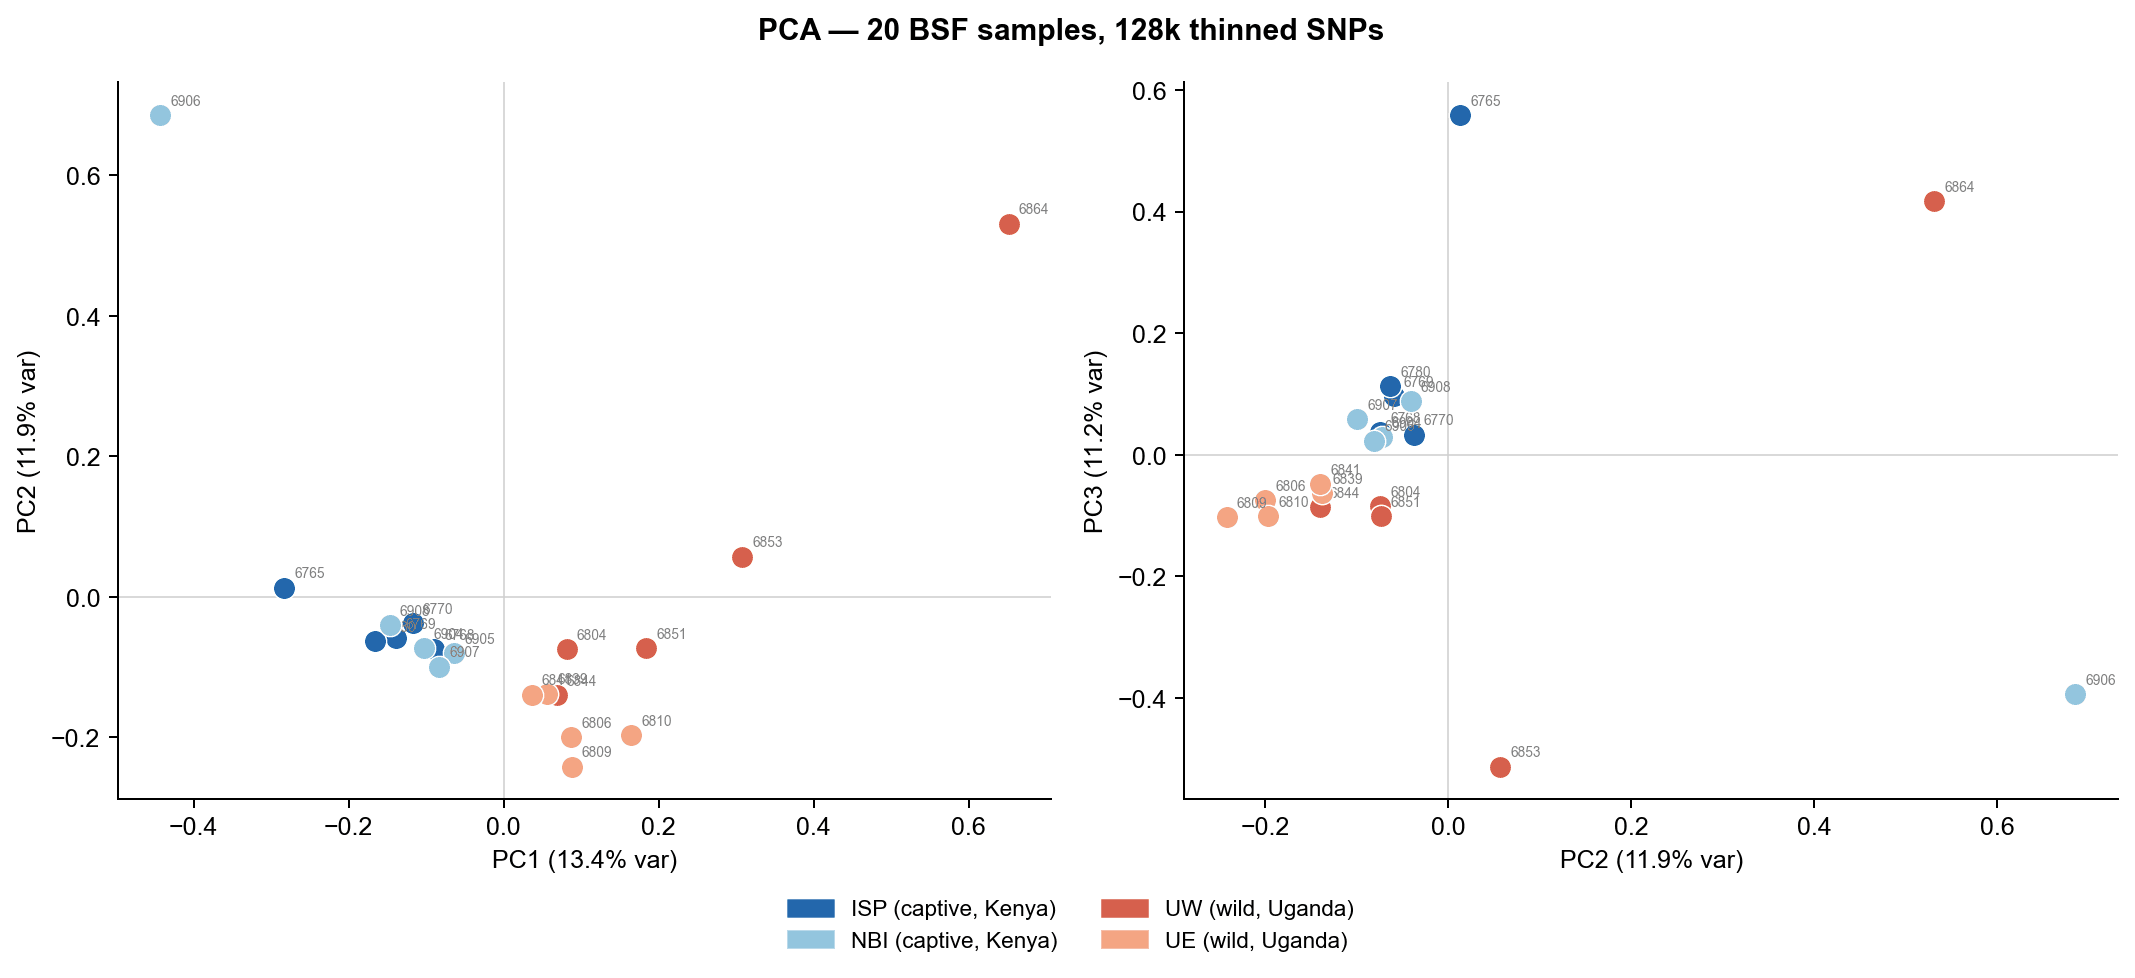
PCA based on 128,007 LD-pruned SNPs separated captive Kenyan populations (ISP, NBI) from the wild Ugandan population (UW). sNMF admixture analysis (K=2) supported this pattern, with ISP and UW showing distinct ancestry profiles and NBI displaying slightly greater admixture variability.

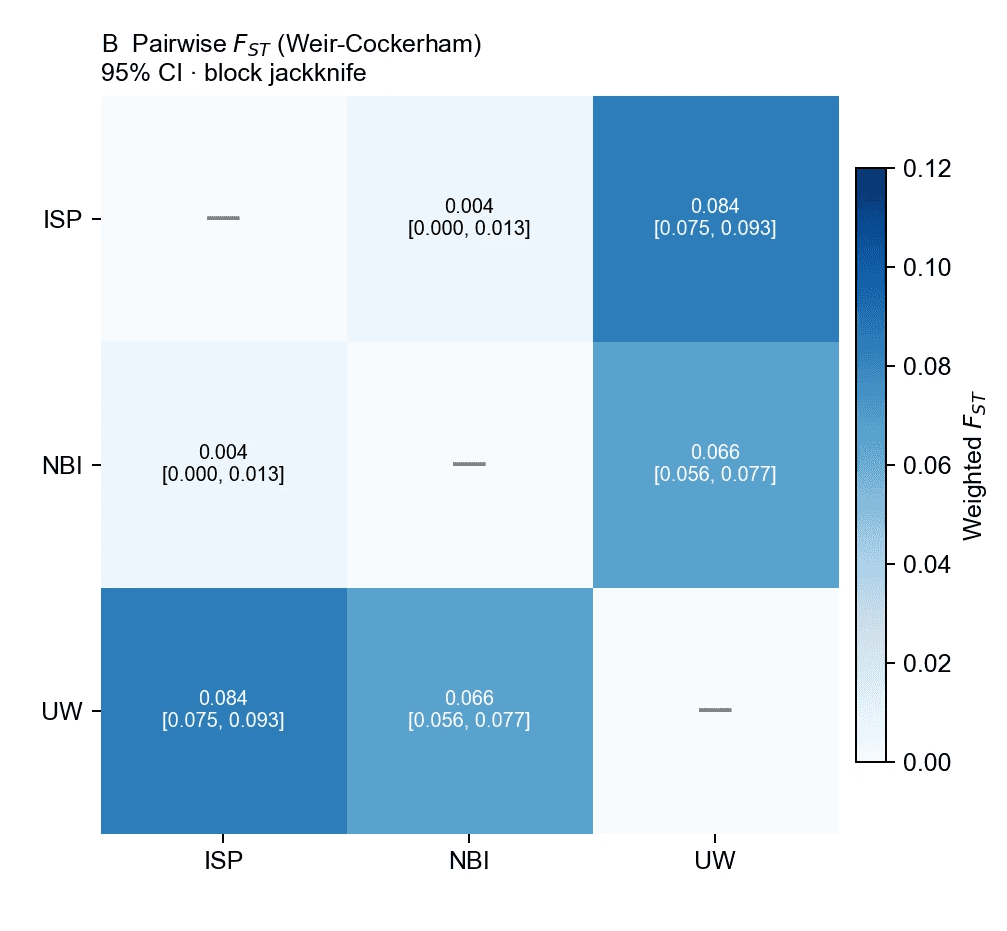
Pairwise hard-call FST estimates indicated low differentiation between ISP and NBI (FST = 0.004) and moderate differentiation between captive and wild populations (ISP–UW = 0.084; NBI–UW = 0.066).
Genotype-Likelihood Validated Population Structure
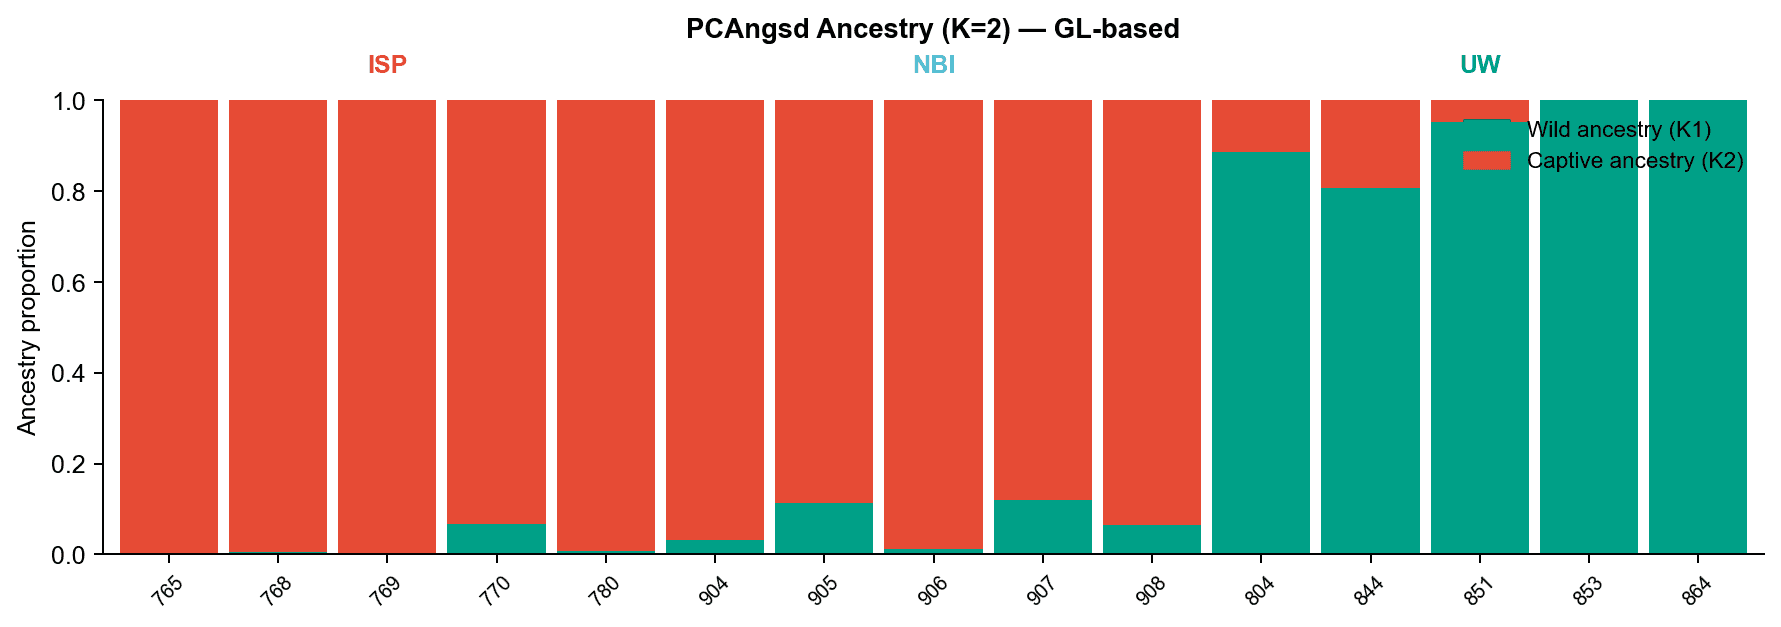
Genotype-likelihood (GL) analyses confirmed the captive–wild population structure observed in the hard-call analysis while providing improved resolution. PCAngsd identified one notable NBI outlier (SRR34006906), which may represent admixture, contamination, or an atypical breeding lineage.

GL-based admixture analysis showed strong captive ancestry in ISP (99.3%) and NBI (92.4%), while UW individuals exhibited predominantly wild ancestry.
GL-corrected FST estimates revealed substantially higher differentiation than hard-call methods, particularly between ISP and NBI (0.046 vs. 0.004), representing an 11.5-fold increase. Captive–wild differentiation was also elevated (ISP–UW = 0.113; NBI–UW = 0.106).
Comparison
Hard-call FST (PLINK2)
GL-based FST (realSFS)
Fold Change
ISP–NBI (captive–captive)
0.004
0.0046
11.5
ISP–UW (captive–wild)
0.084
0.113
1.3
NBI–UW (captive–wild)
0.066
0.106
1.6
Selective Sweep Scans
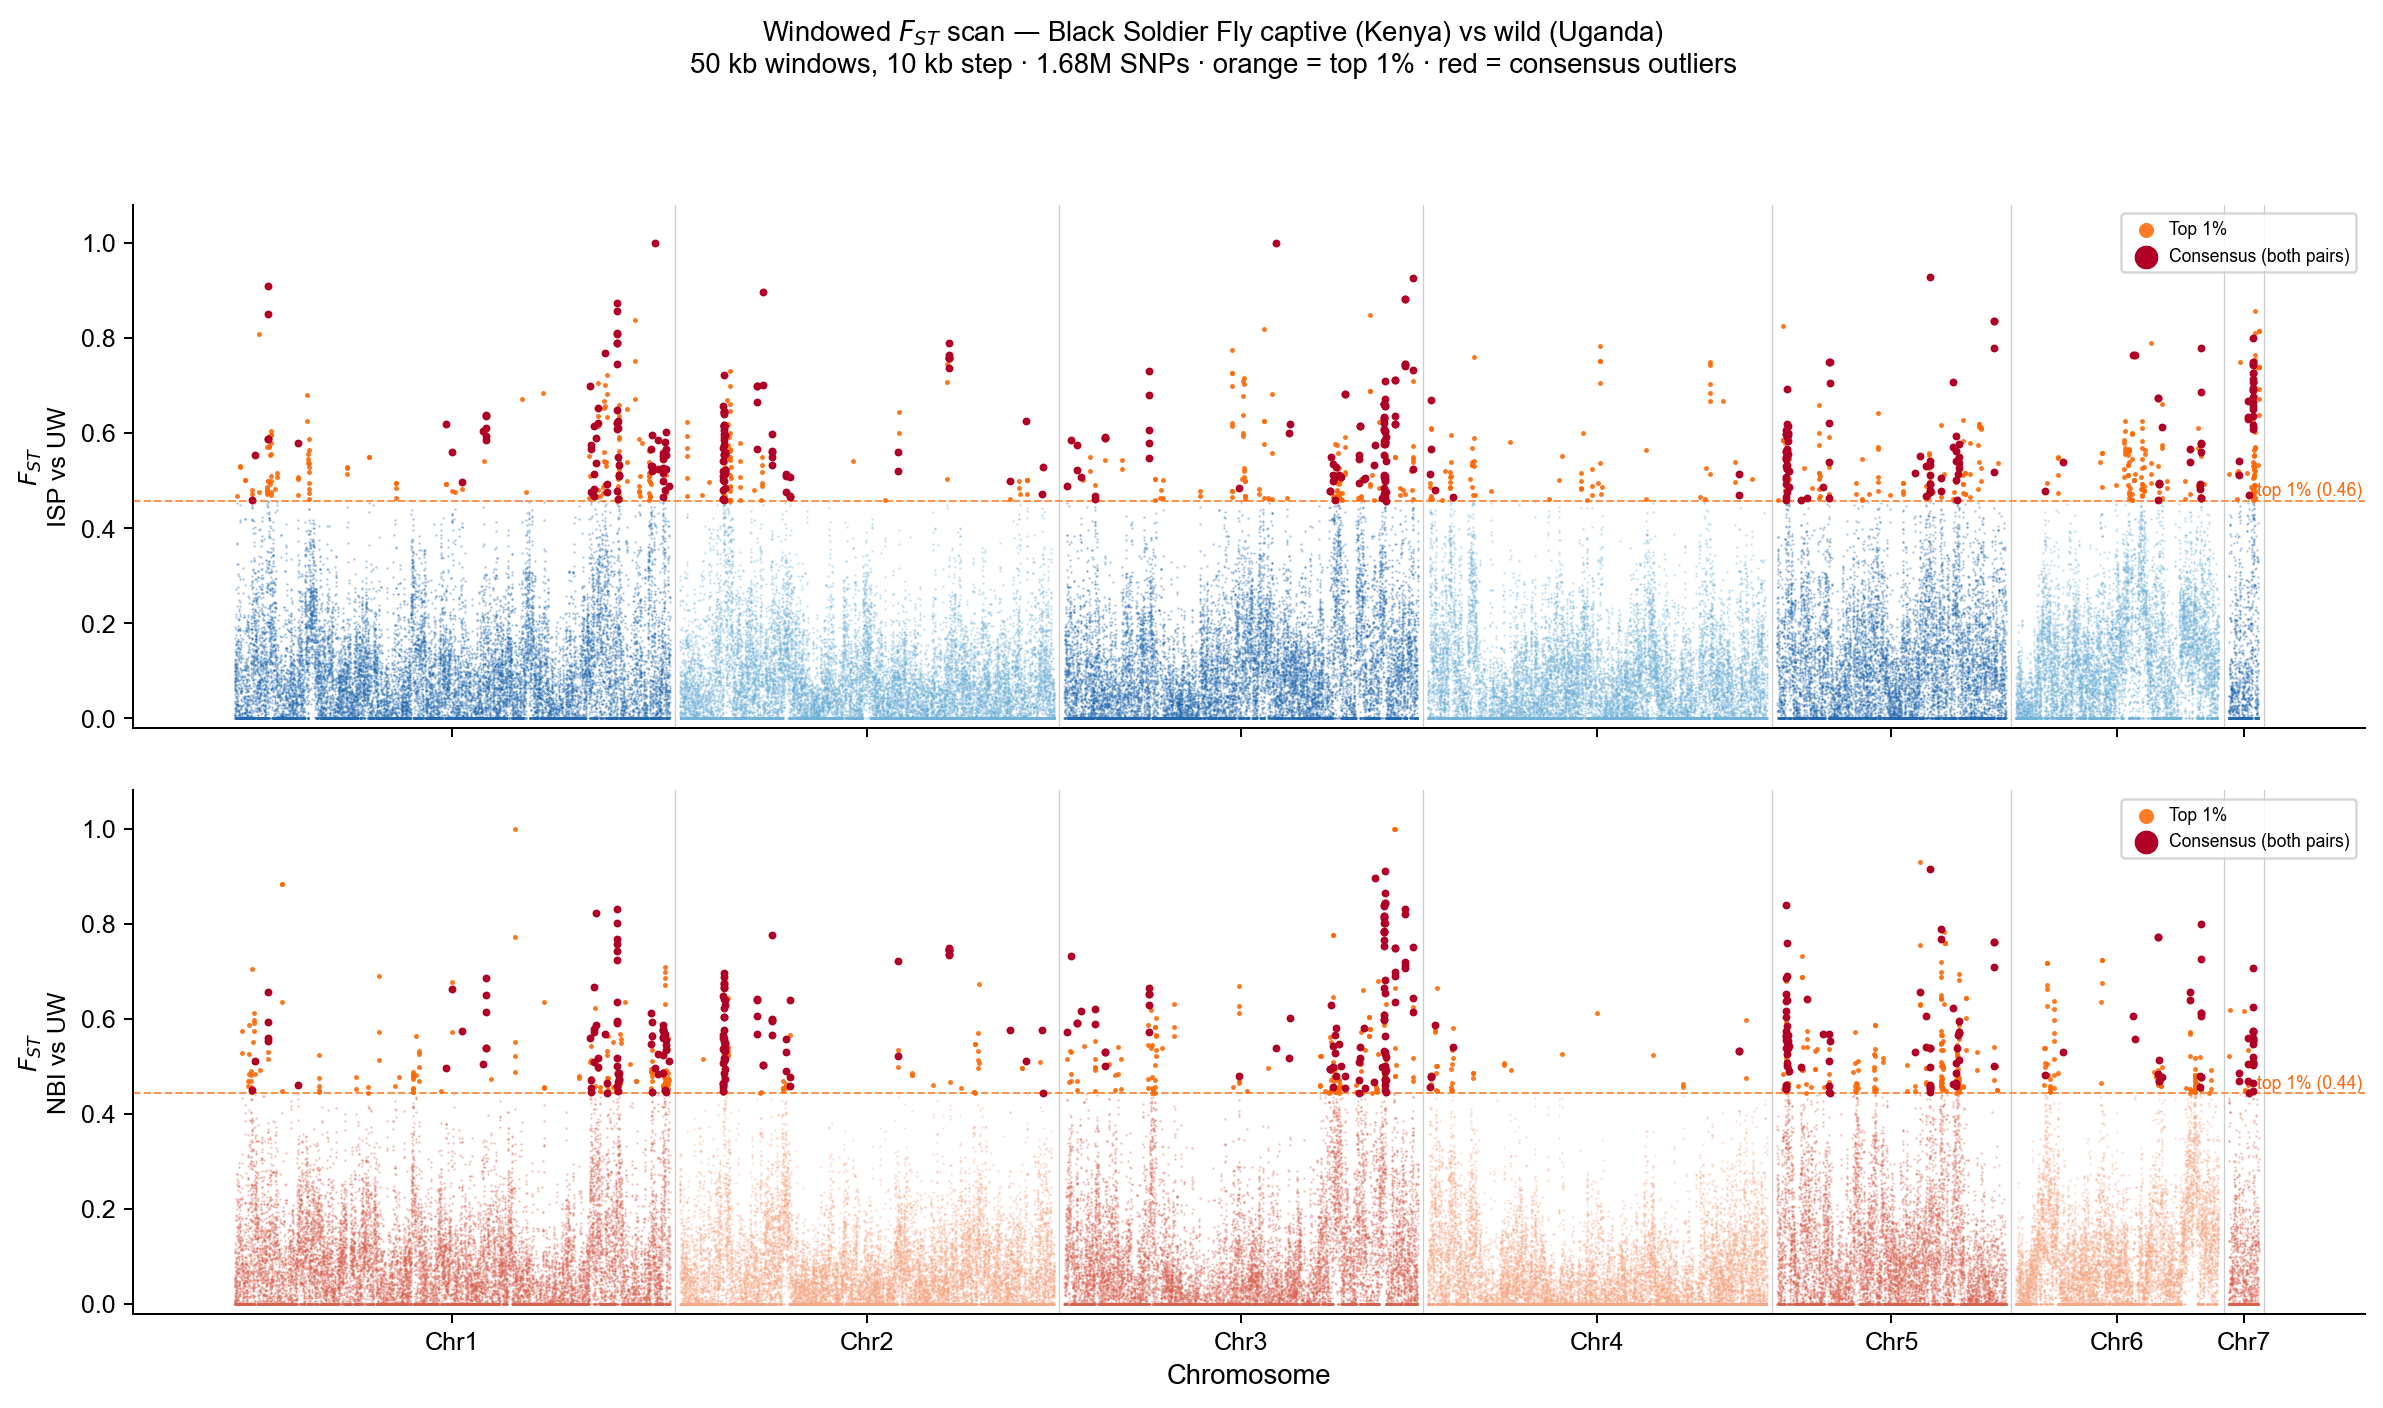
Hard-call windowed FST scans identified candidate selective sweep regions on Chr5 (~77.9 Mb) and Chr3 (~173.5 Mb).
GL-based analysis revealed a stronger signal on Chr2 (~137.35 Mb), with peak FST values of 0.801 (ISP–UW) and 0.753 (NBI–UW). This region was shared across both captive populations and represents the strongest candidate locus under selection during domestication.
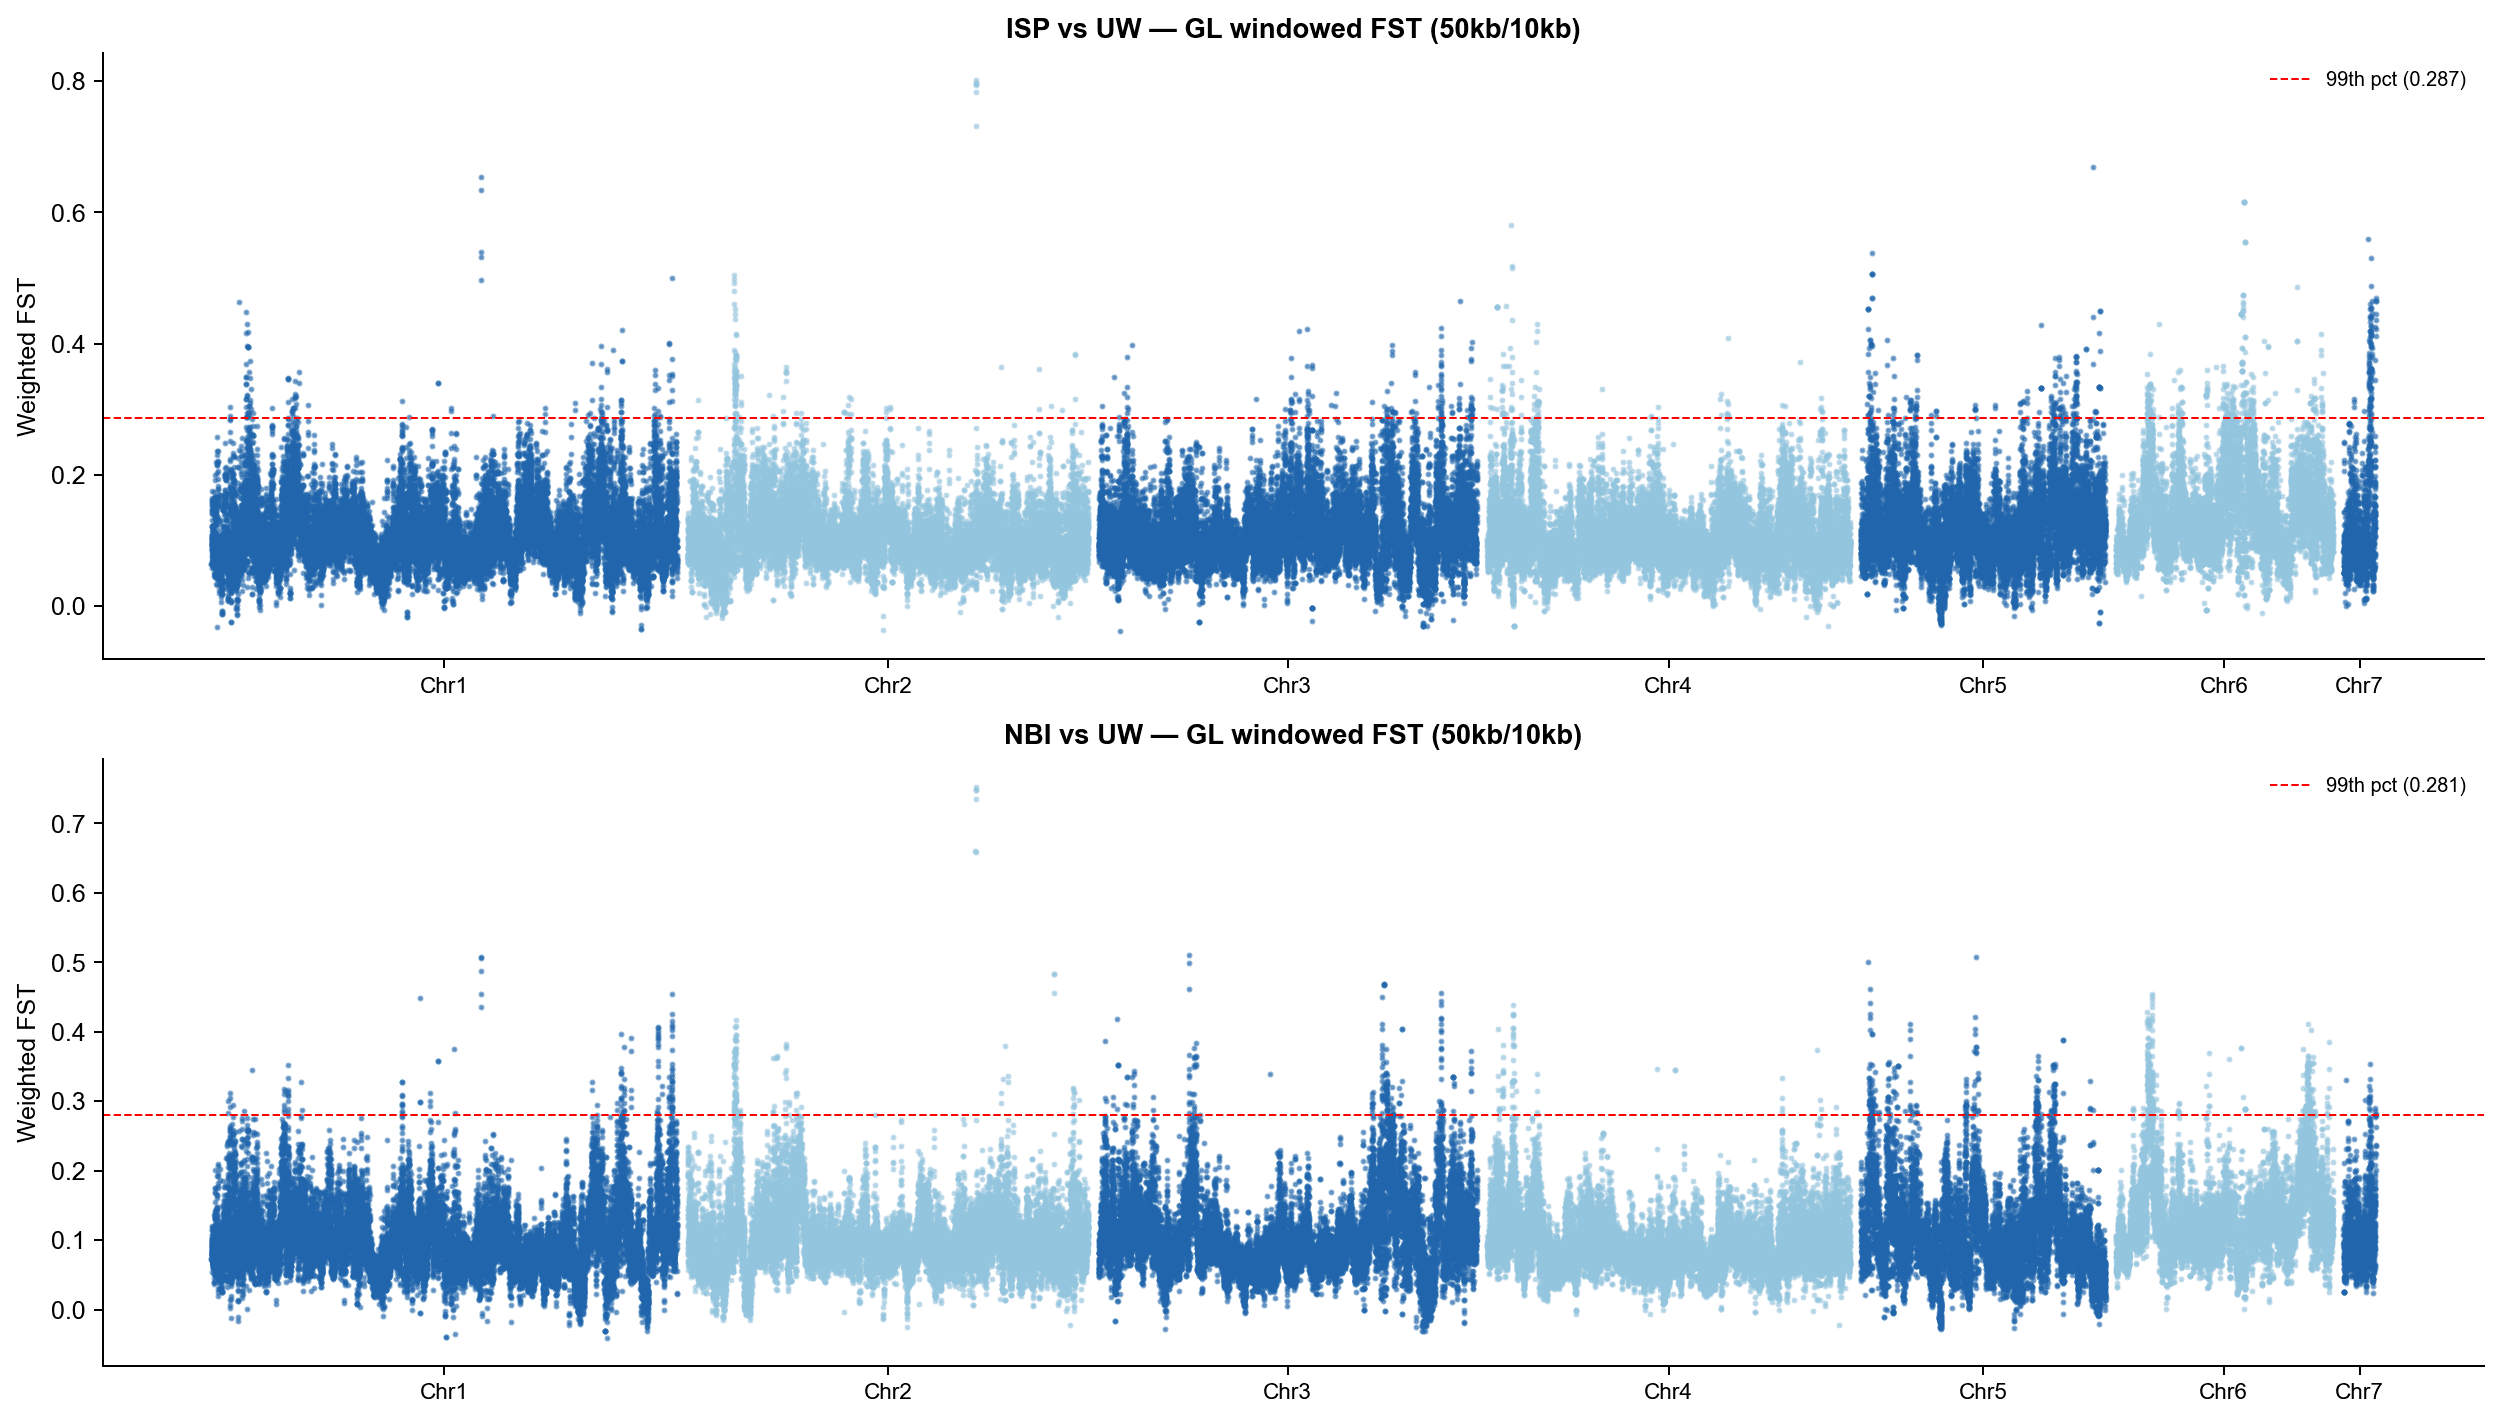
Cross-validation supported Chr5 as a secondary candidate region, whereas the Chr3 signal fell below GL significance thresholds and should be considered tentative.
Locus
Chromosome
Position
Hard-call max FST
GL max FST (ISP–UW)
GL max FST (NBI–UW)
GL Confirmed
Peak A
Chr2 (LR899010.1)
~137.35 Mb
-
0.801
0.753
Yes (both)
Peak B
Chr5 (LR899013.1)
~77.9 Mb
Top candidate
0.312
0.260
Yes (>99th percentile)
Peak C
Chr3 (LR899011.1)
~173.5 Mb
Top candidate
0.235
0.235
Borderline