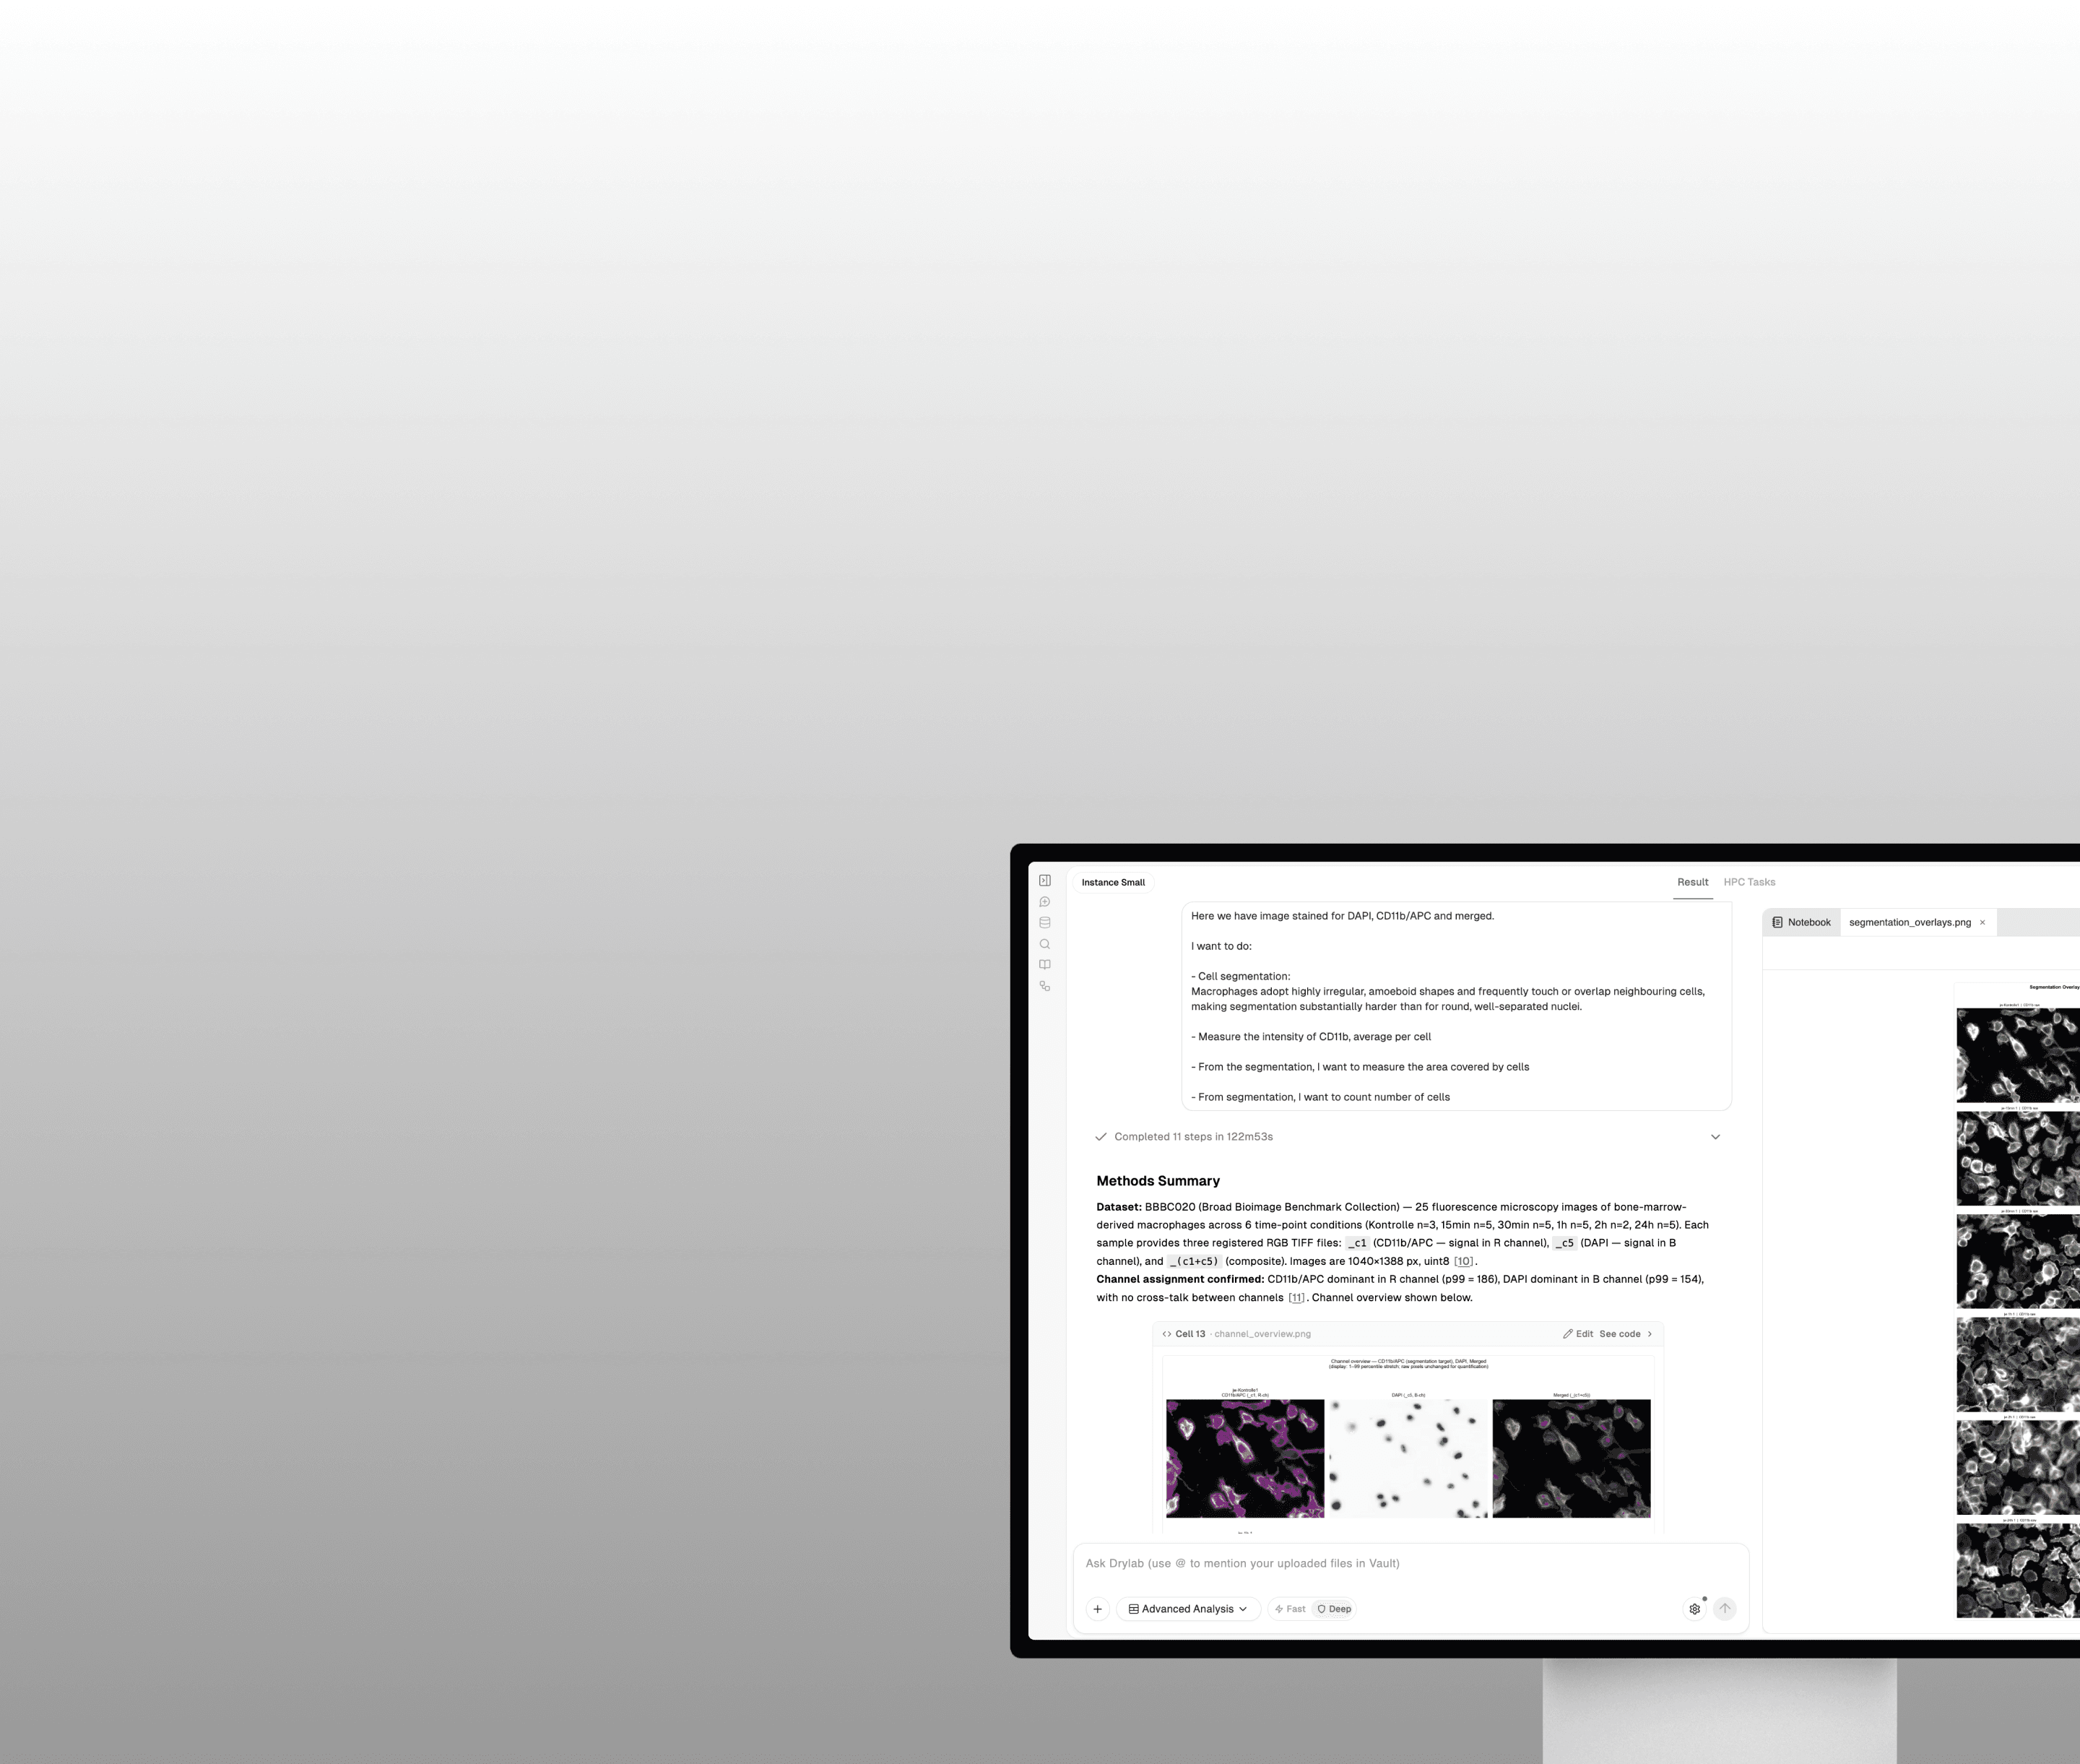

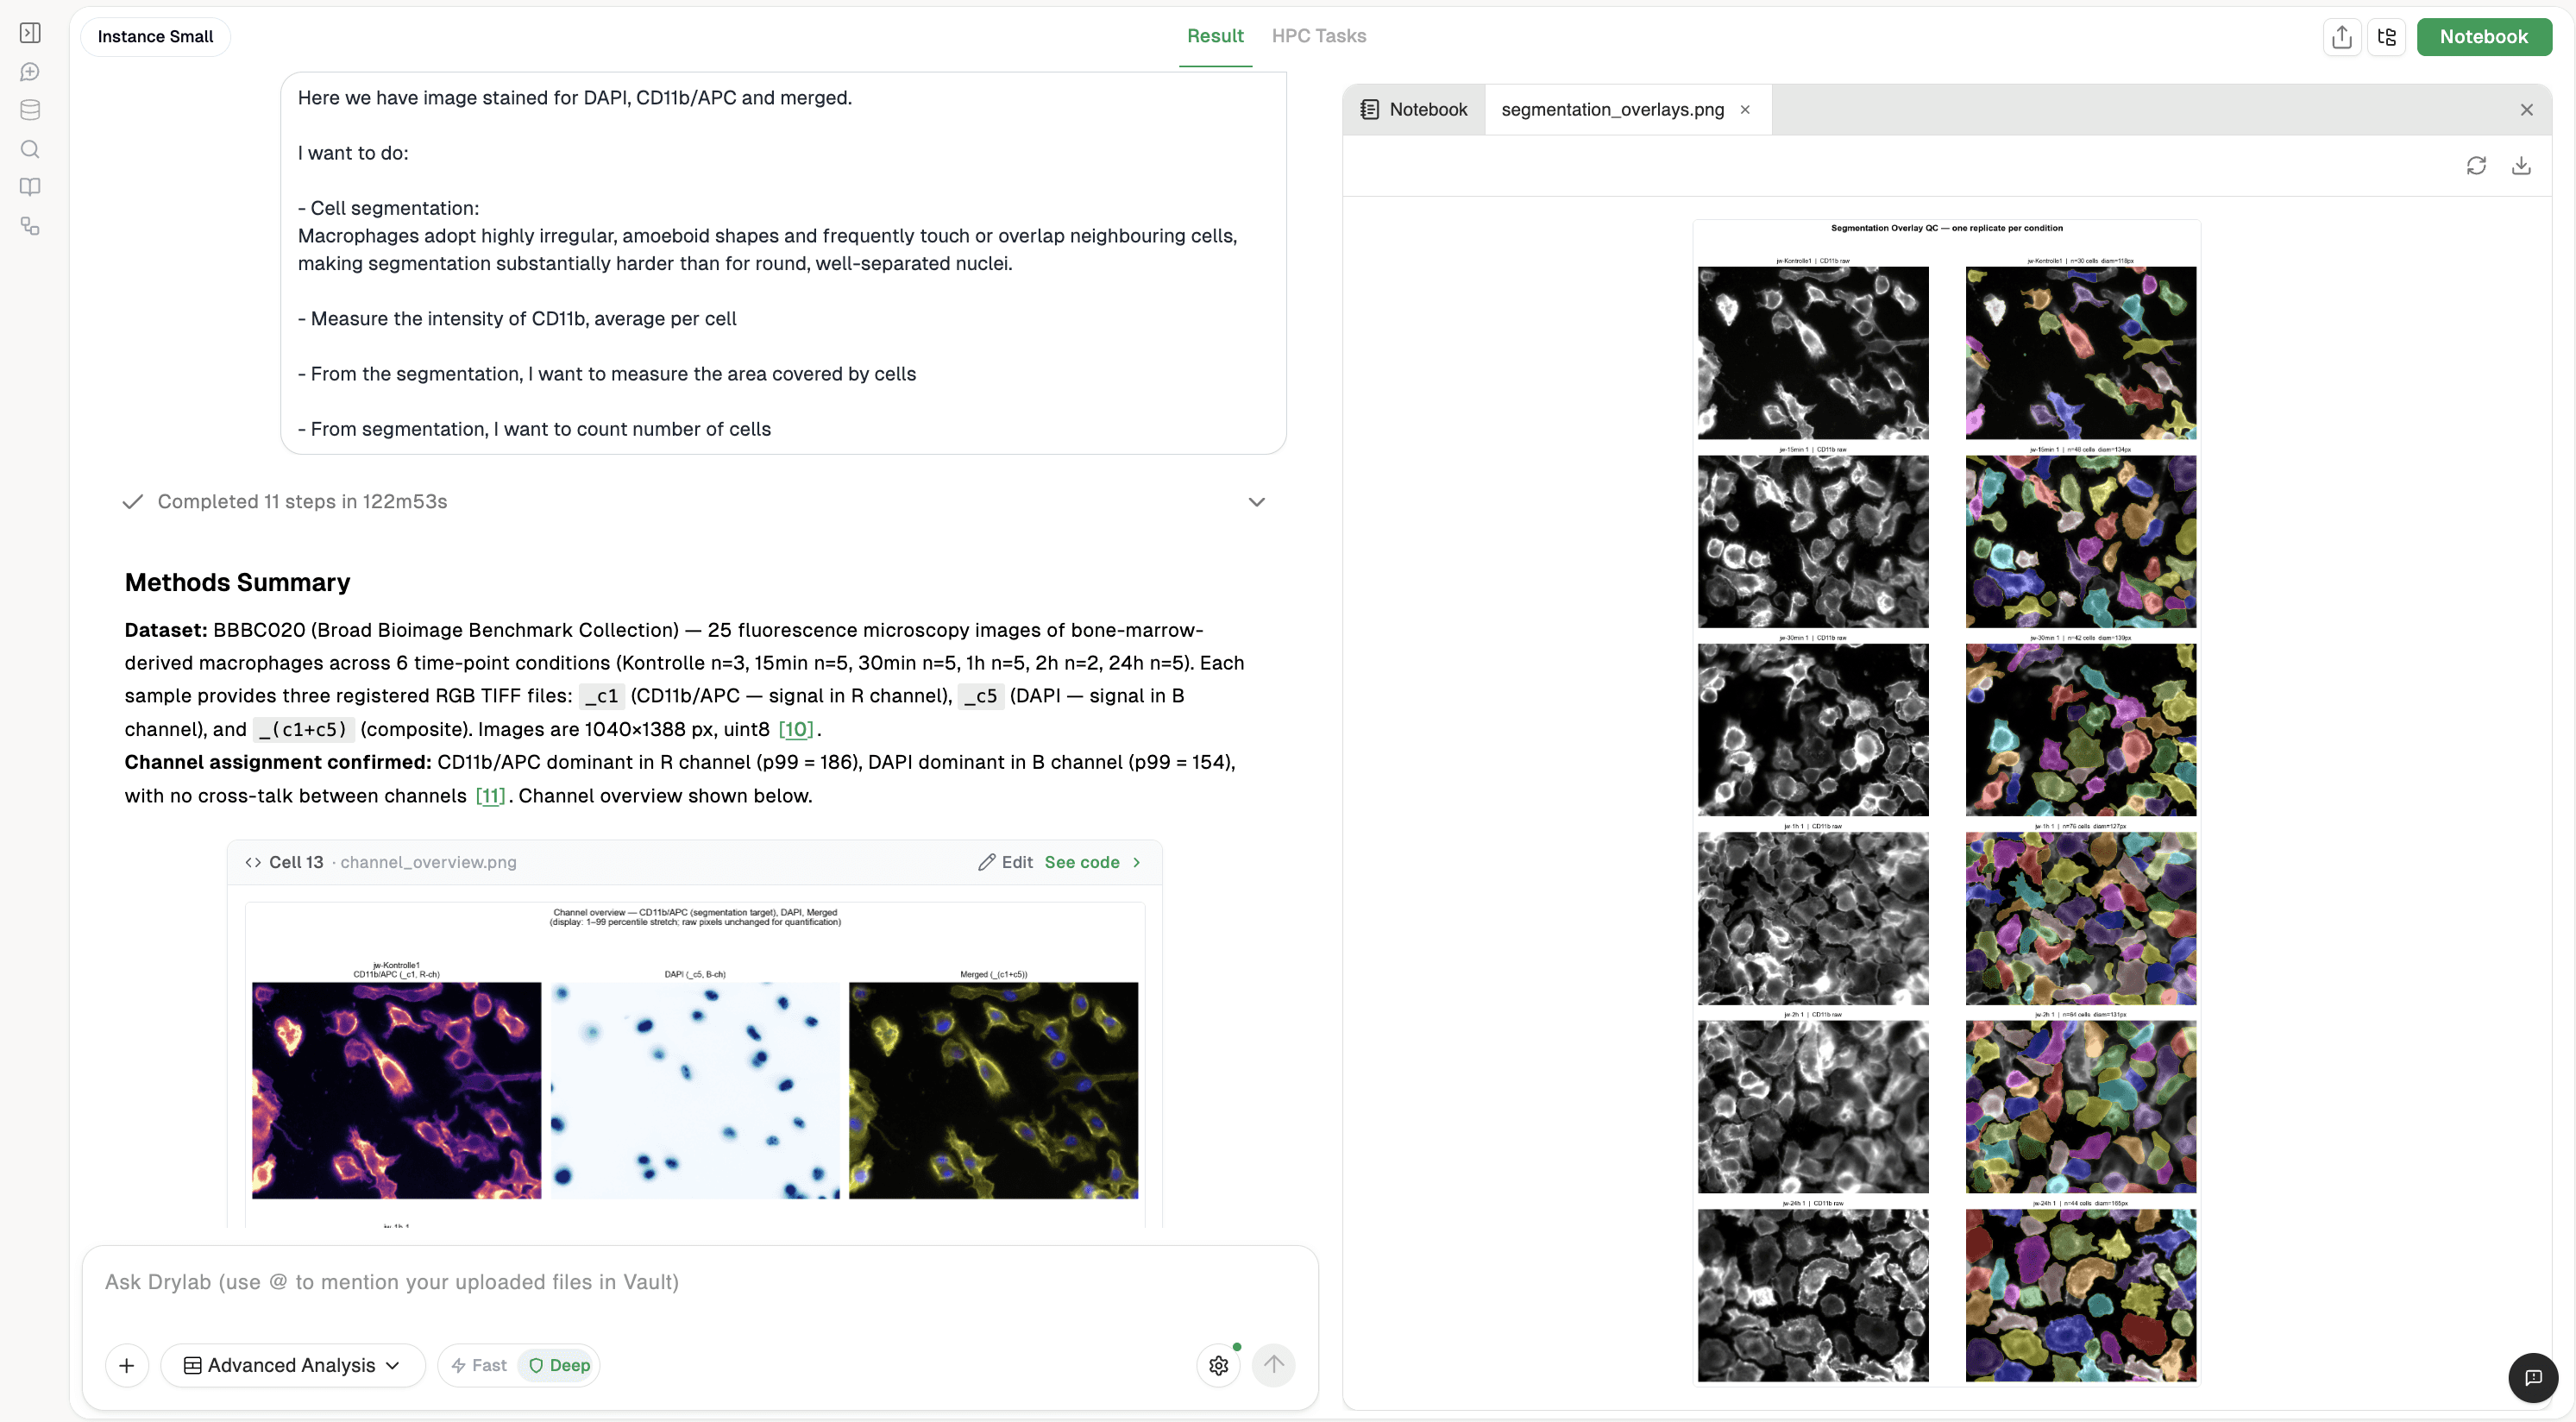
This use case was co-created by academic researchers and Drylab. The full chat conversation demonstrates how researchers interact with Drylab to perform analyses, ask questions, and adapt workflows as new insights emerge.
We hope these examples inspire new approaches and possibilities in your own research.
Summary
Analyze fluorescence microscopy images to automatically segment macrophages, quantify CD11b expression at the single-cell level, measure cell coverage, and count cells across experimental conditions. The workflow is optimized for irregular, amoeboid macrophage morphology and densely packed cell populations.
Input
Fluorescence microscopy images
DAPI channel (nuclei)
CD11b/APC channel (macrophage marker)
Optional merged images
Output
Single-cell segmentation masks
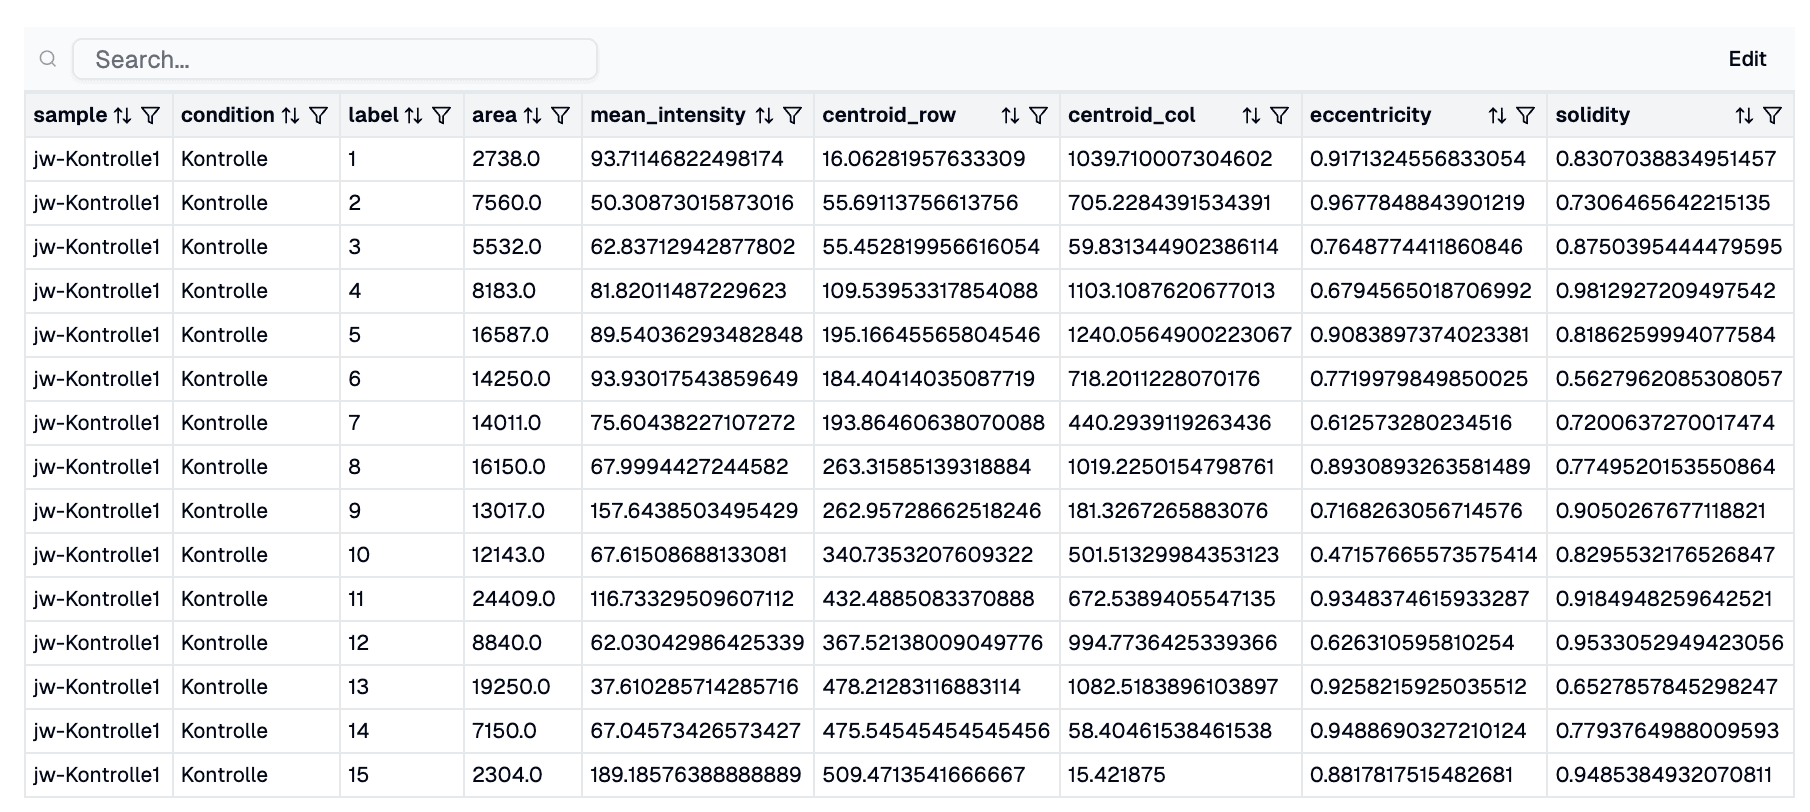
Cell morphology measurements (area, eccentricity, solidity)
Cell count per image
Cell-covered area (% image area)
Mean CD11b intensity per cell
Statistical comparisons across conditions
Analysis breakdown
Dataset: BBBC020 (Broad Bioimage Benchmark Collection) — 25 fluorescence microscopy images of bone-marrow-derived macrophages across 6 time-point conditions (Kontrolle n=3, 15min n=5, 30min n=5, 1h n=5, 2h n=2, 24h n=5).
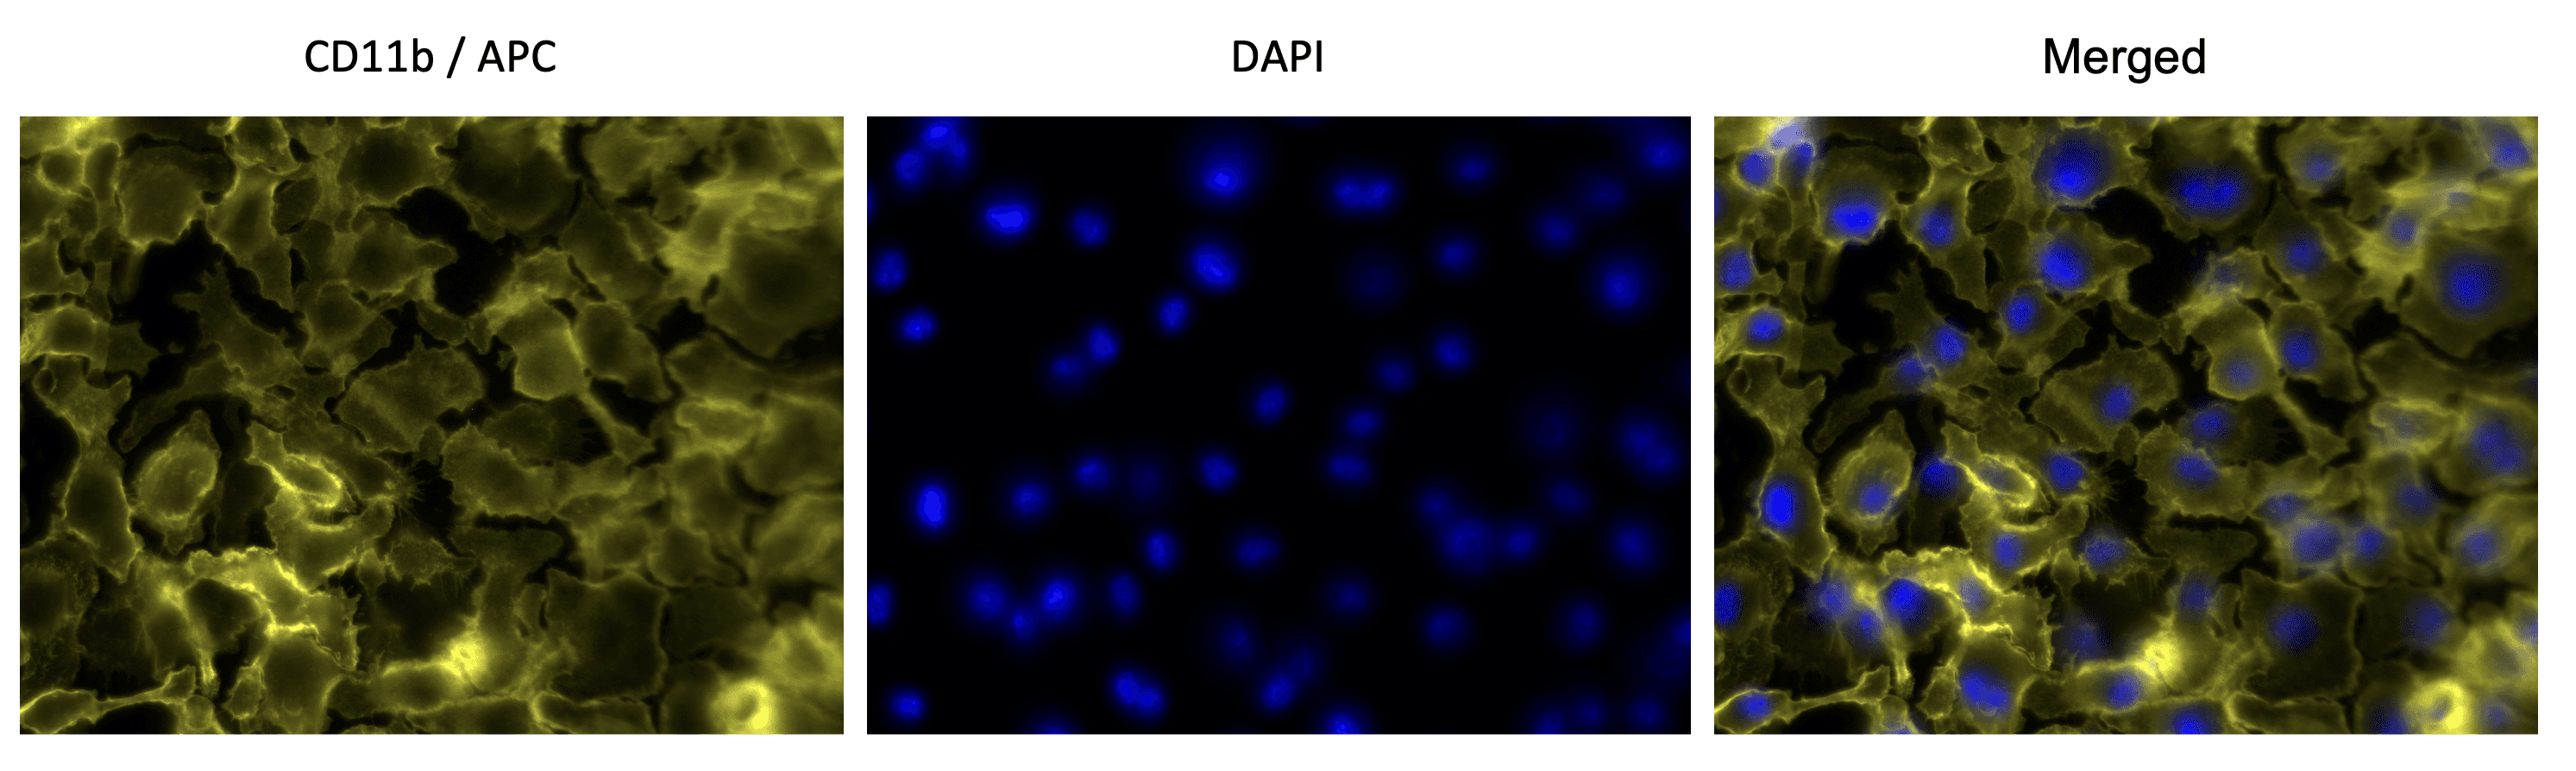
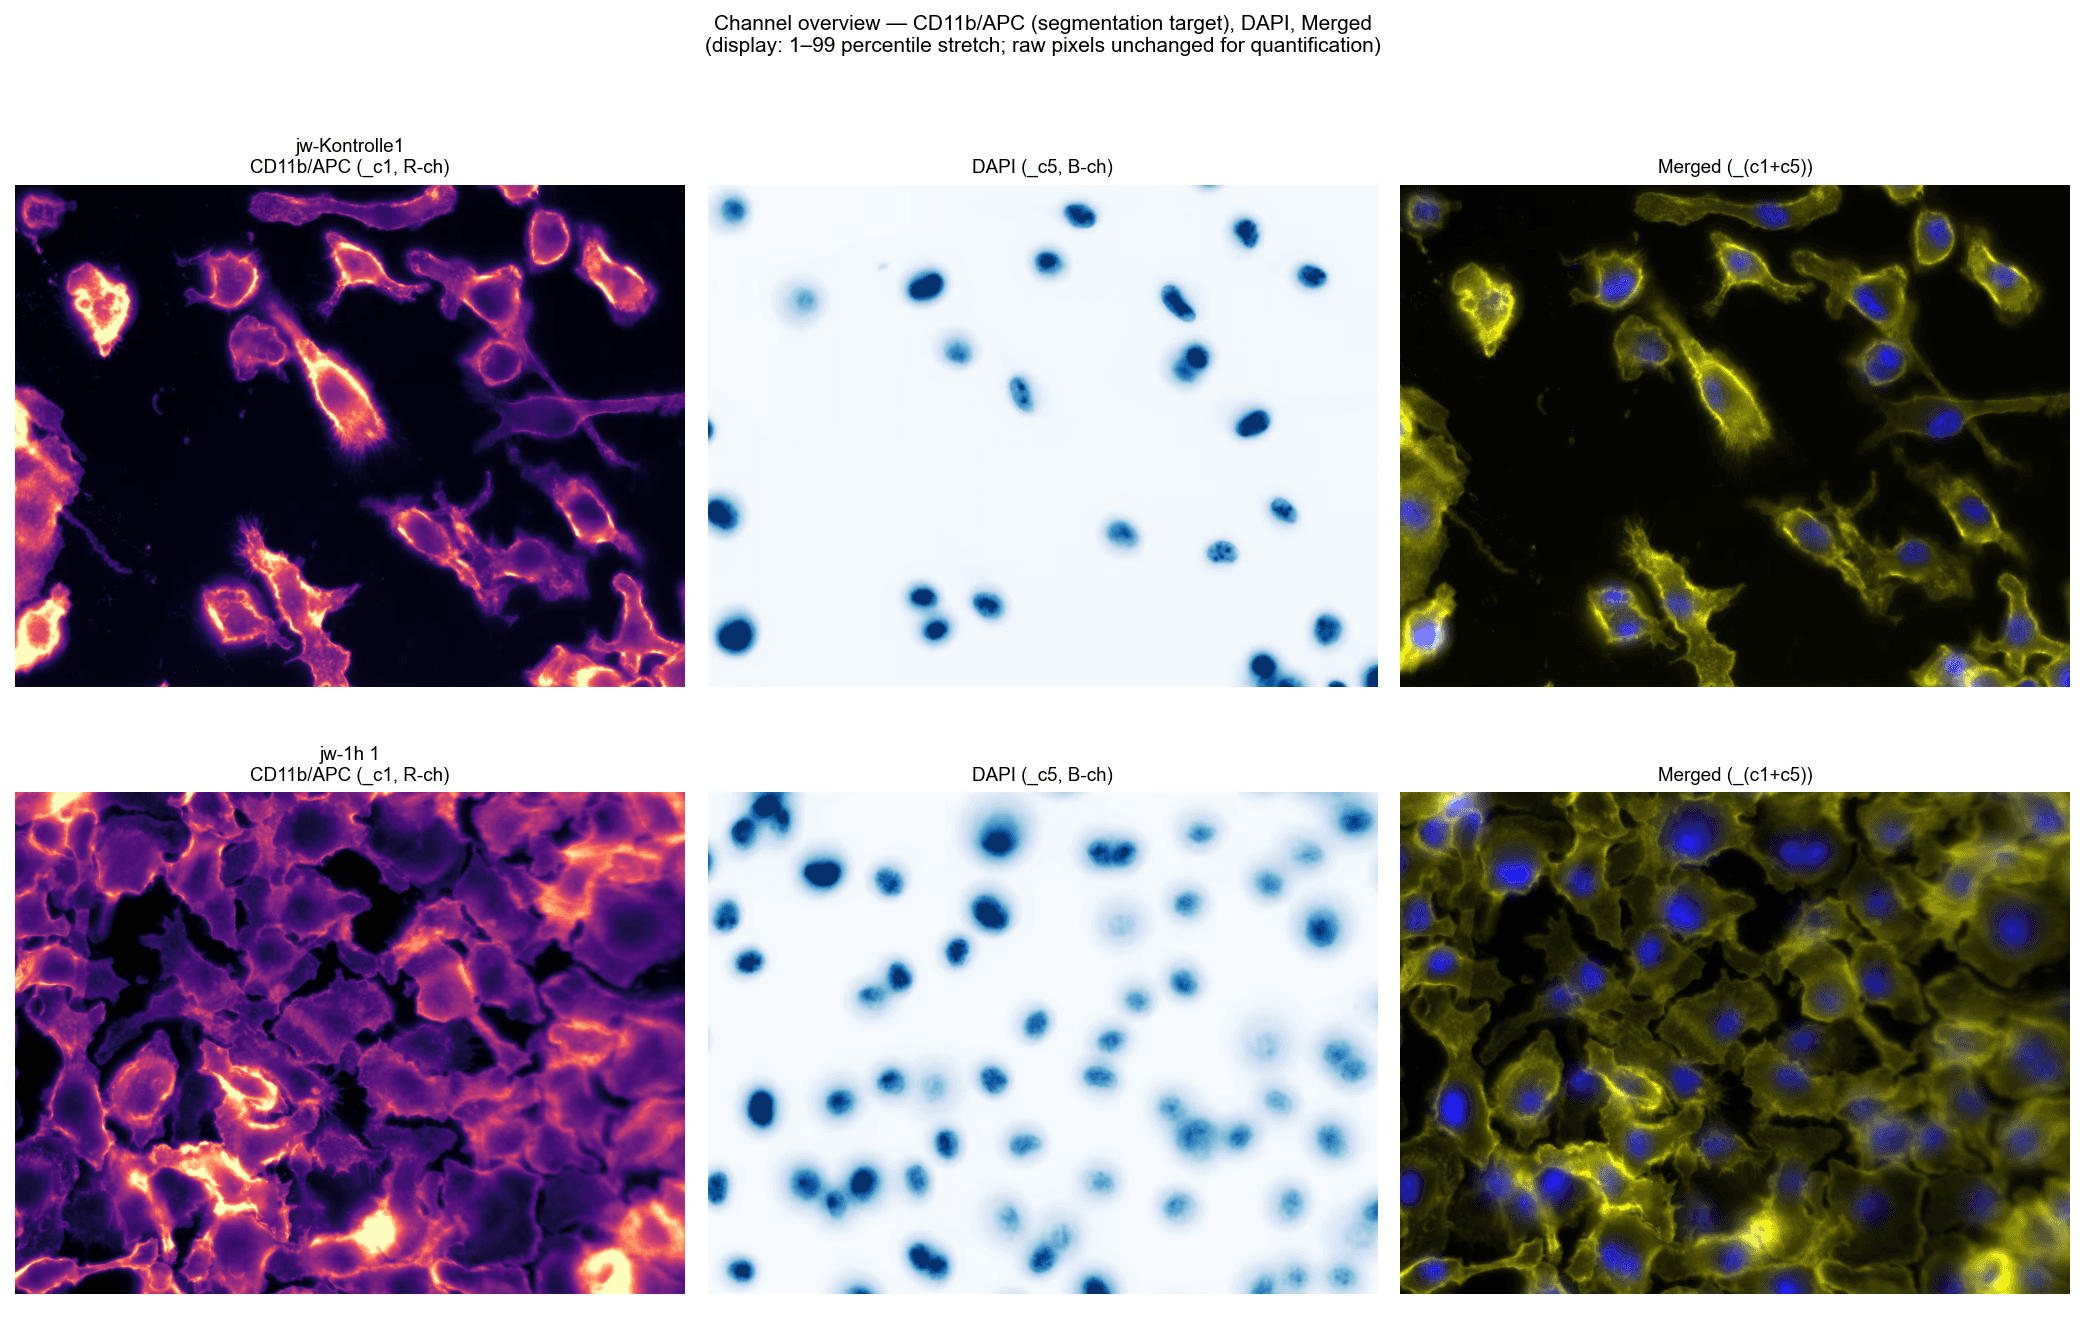
Each sample provides three registered RGB TIFF files: _c1 (CD11b/APC — signal in R channel), _c5 (DAPI — signal in B channel), and _(c1+c5) (composite). Images are 1040×1388 px, uint8 .
Channel assignment confirmed: CD11b/APC dominant in R channel (p99 = 186), DAPI dominant in B channel (p99 = 154), with no cross-talk between channels . Channel overview shown below.
Segmentation
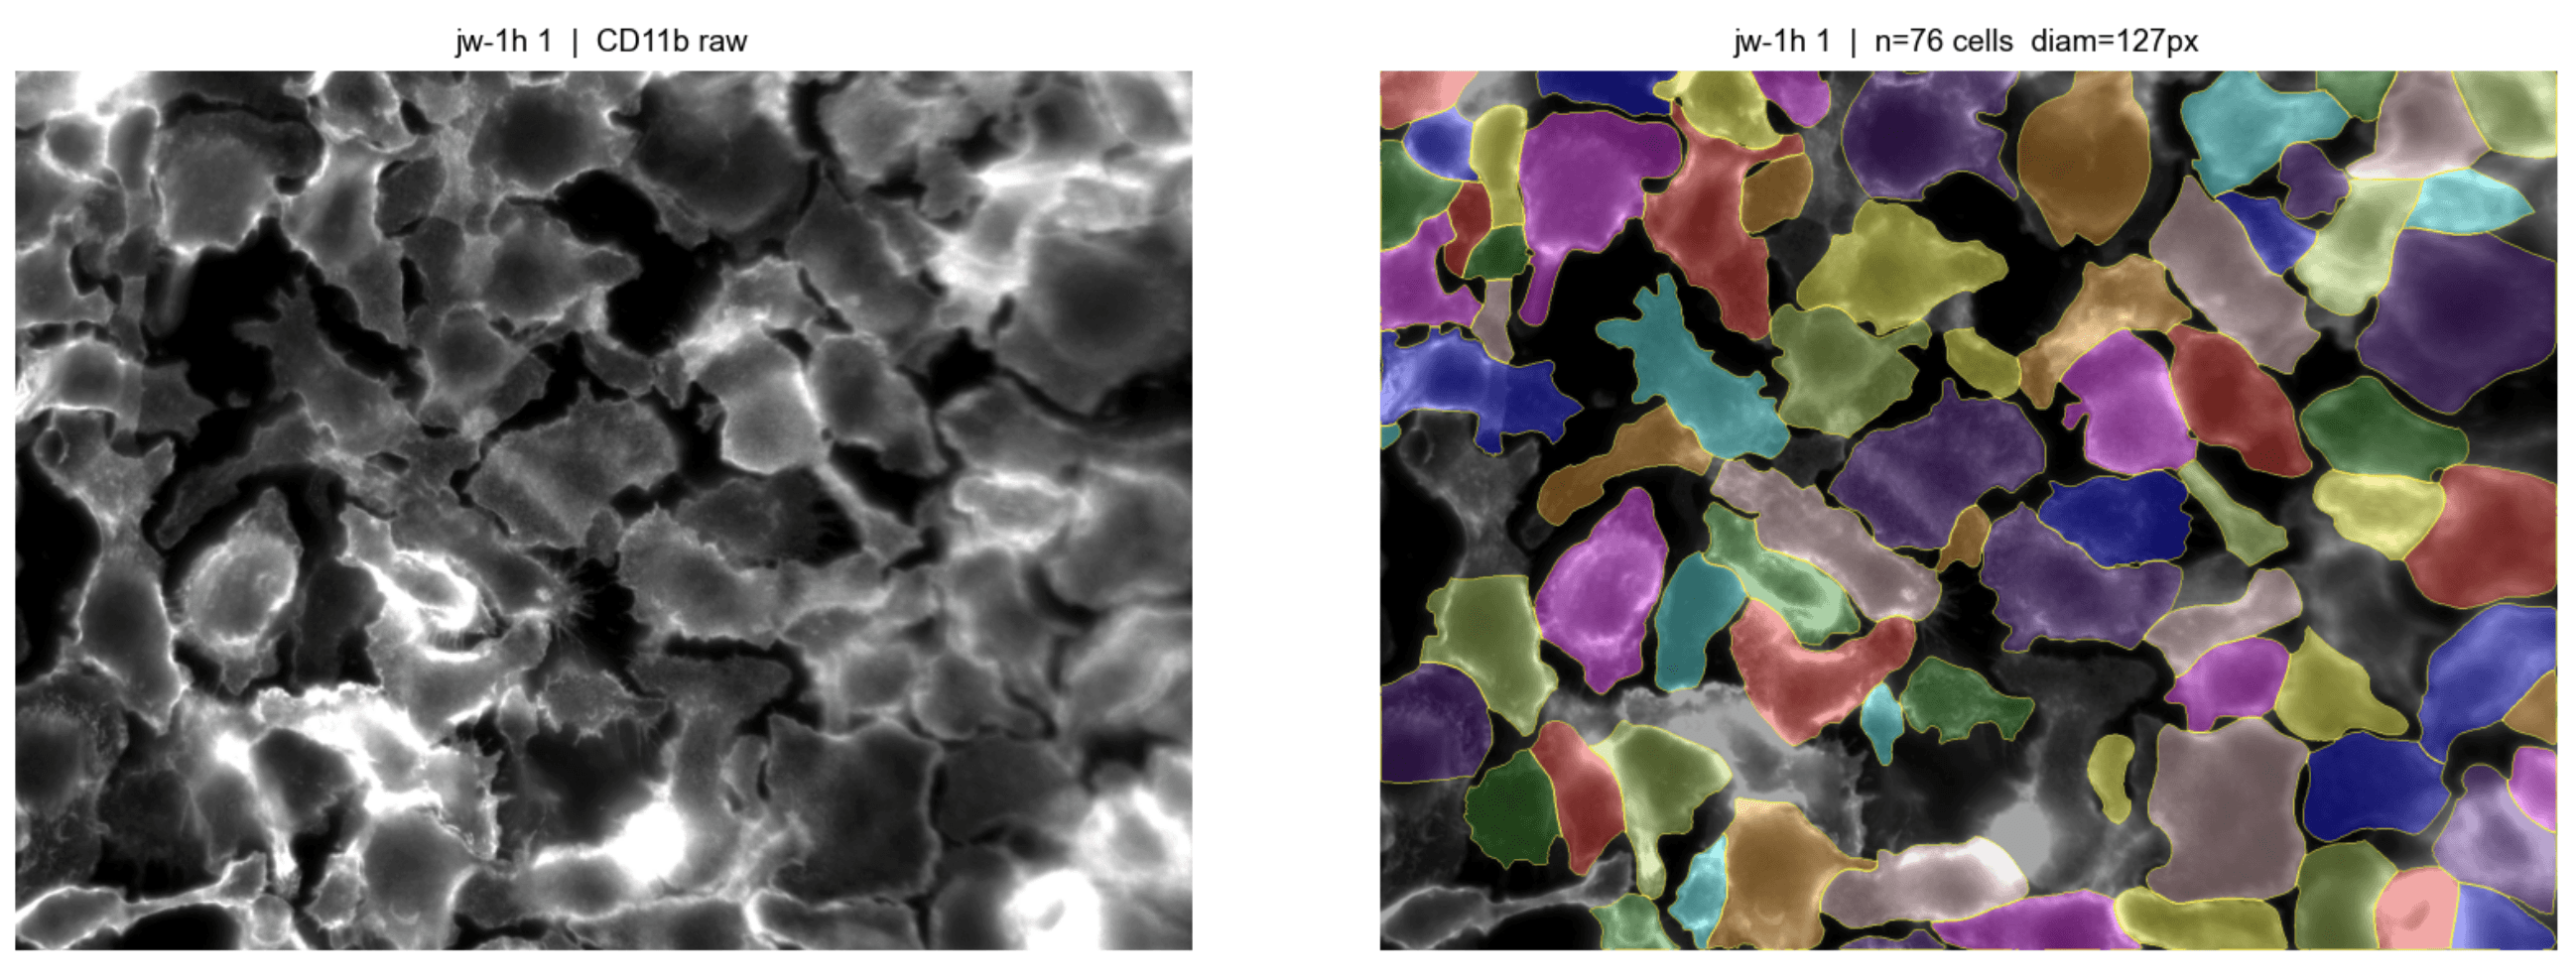
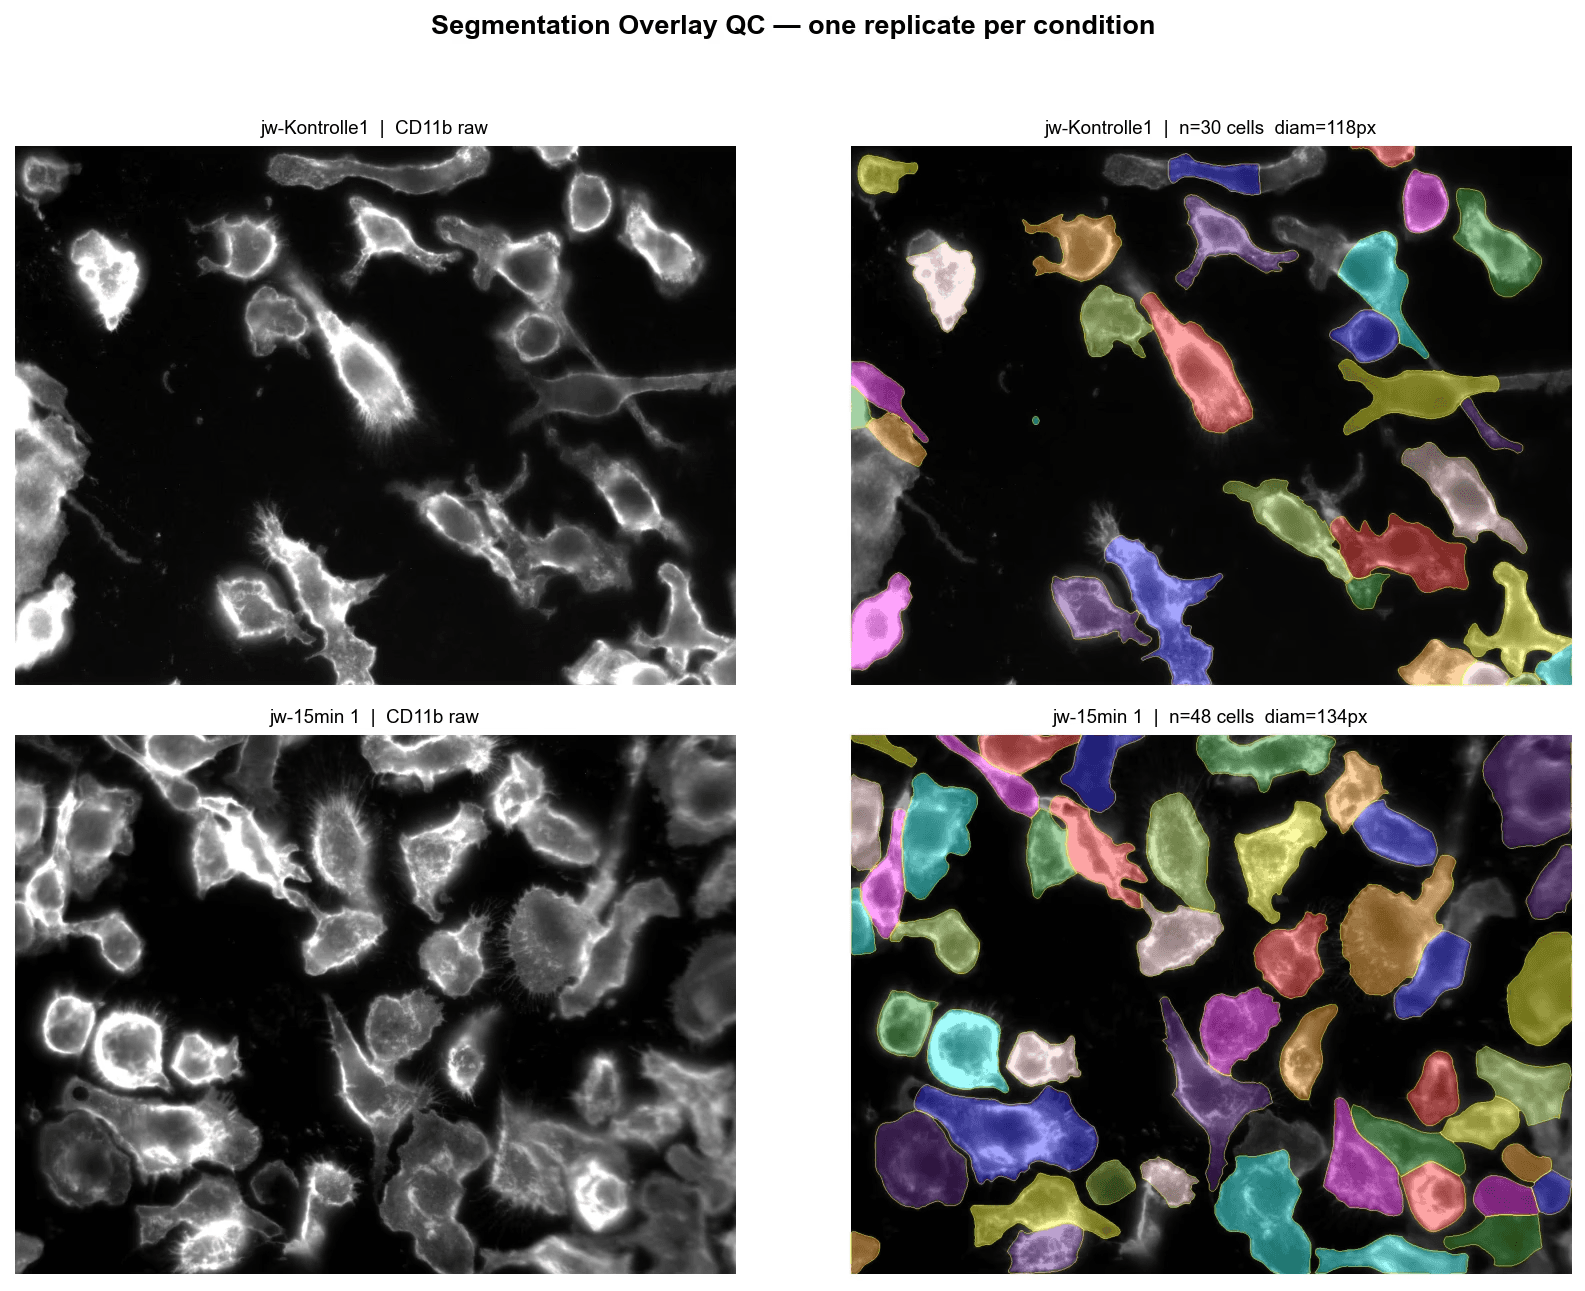
Cellpose cpsam model (v4.0.1+, the successor to cyto3, pretrained on ~70K images) applied to the raw CD11b/APC R-channel (grayscale, channels=[0,0], flow_threshold=0.4, cellprob_threshold=0.0, diameter=None — auto-estimated per image). Empirical cell diameter was derived post-hoc as 2 × sqrt(mean_area / π) from each mask.
All 25 images segmented successfully; total of 1,154 cells detected across the dataset (mean 46 cells/image) .
Area coefficient of variation ranged 0.48–0.91 across all samples — all well below the 1.5 re-segmentation trigger, confirming uniform mask quality .
Empirical cell diameters: 116–172 px, consistent with large amoeboid macrophage morphology across conditions .
Qualitative overlay inspection confirms accurate boundary delineation including in the dense 1h/2h fields.
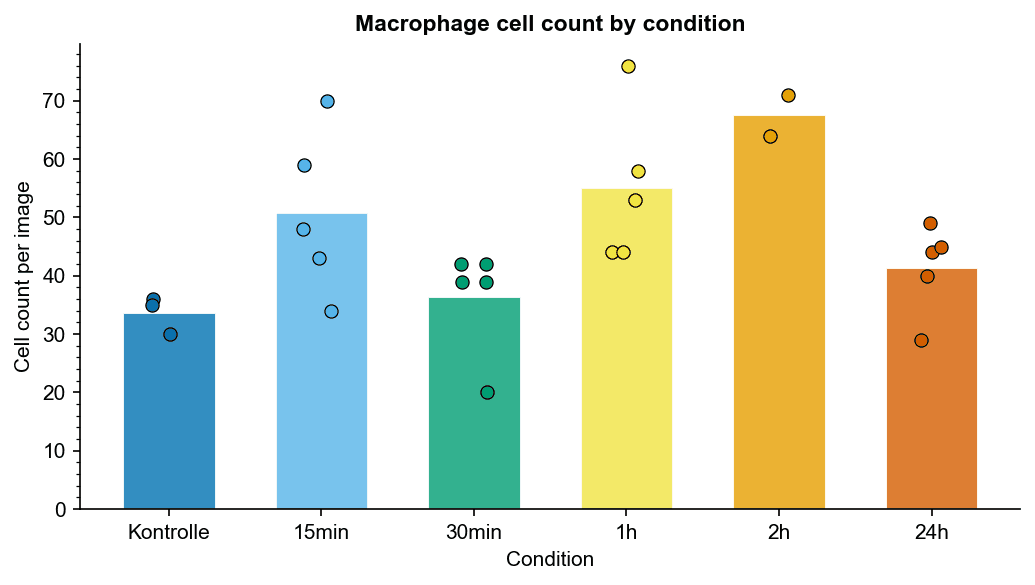
Cell count
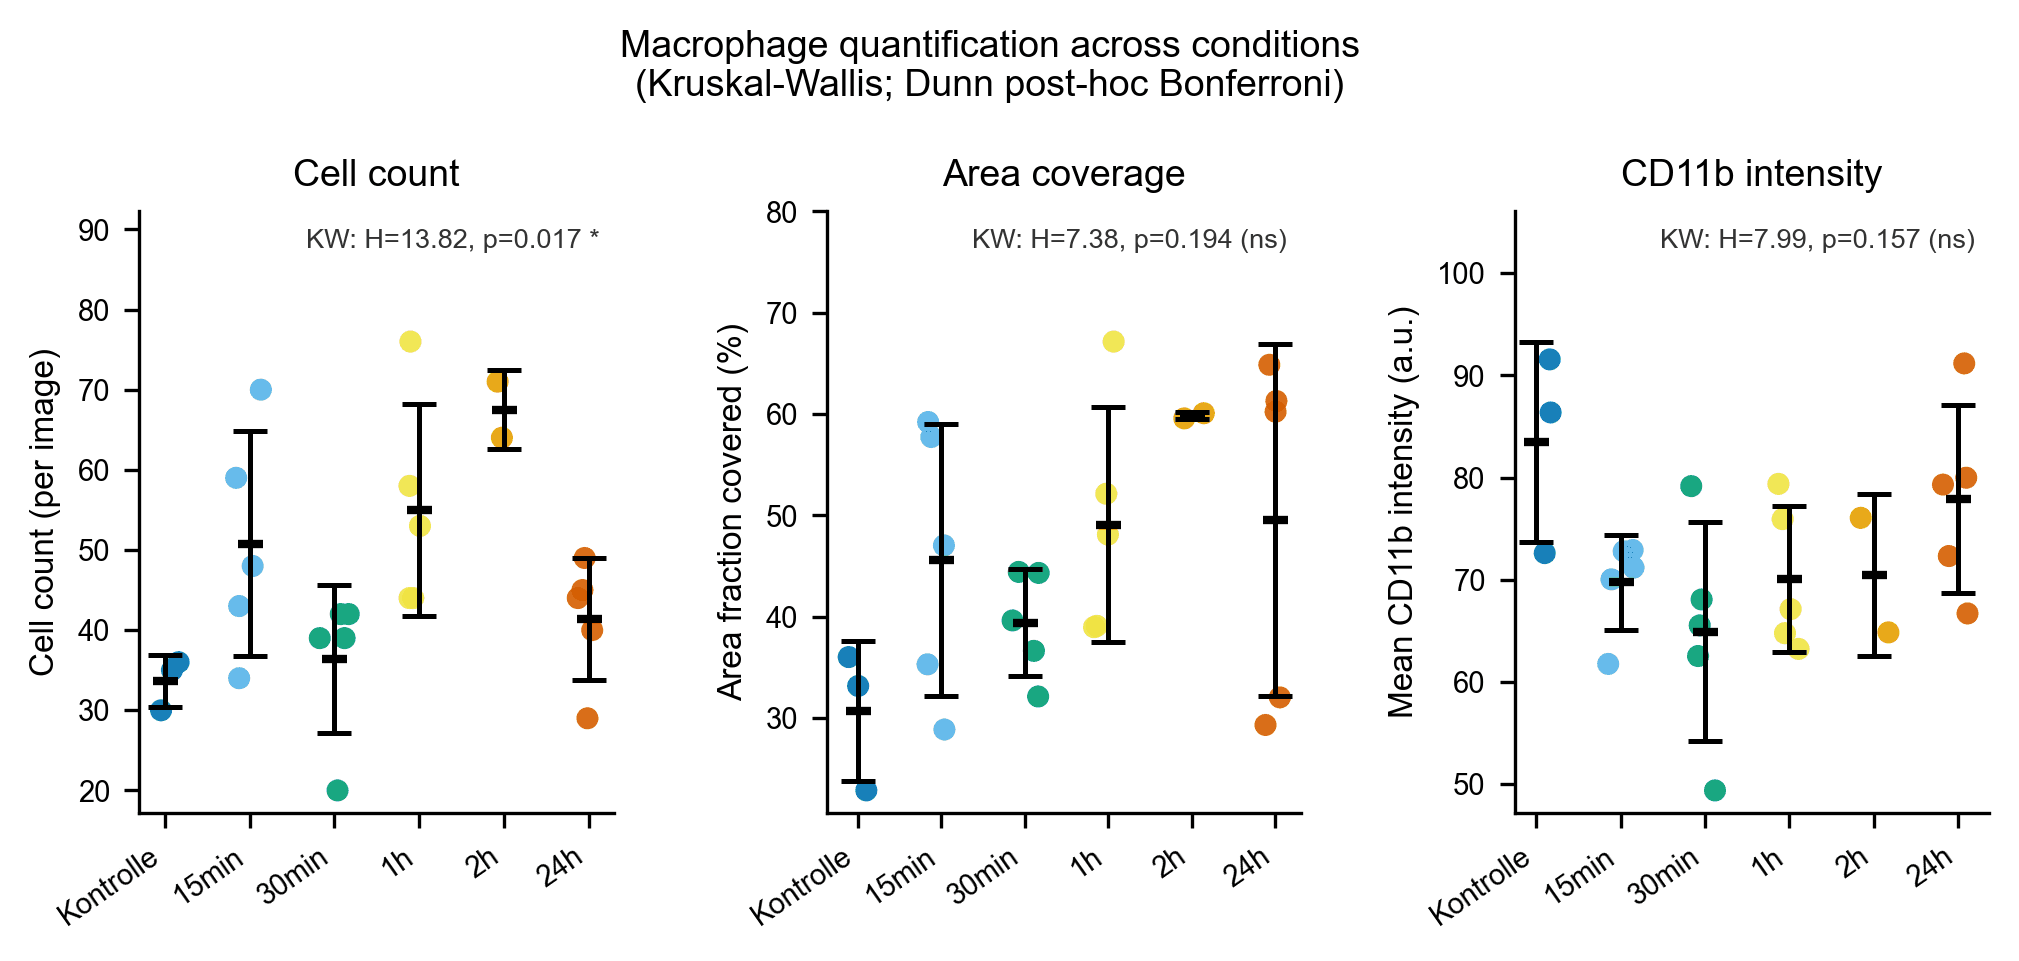
Kontrolle: 30–36 cells/image (mean ~34); rises to 44–76 cells/image at 1h (mean ~55) and 64–71 at 2h (mean ~68); partial decline at 24h (29–49, mean ~41)
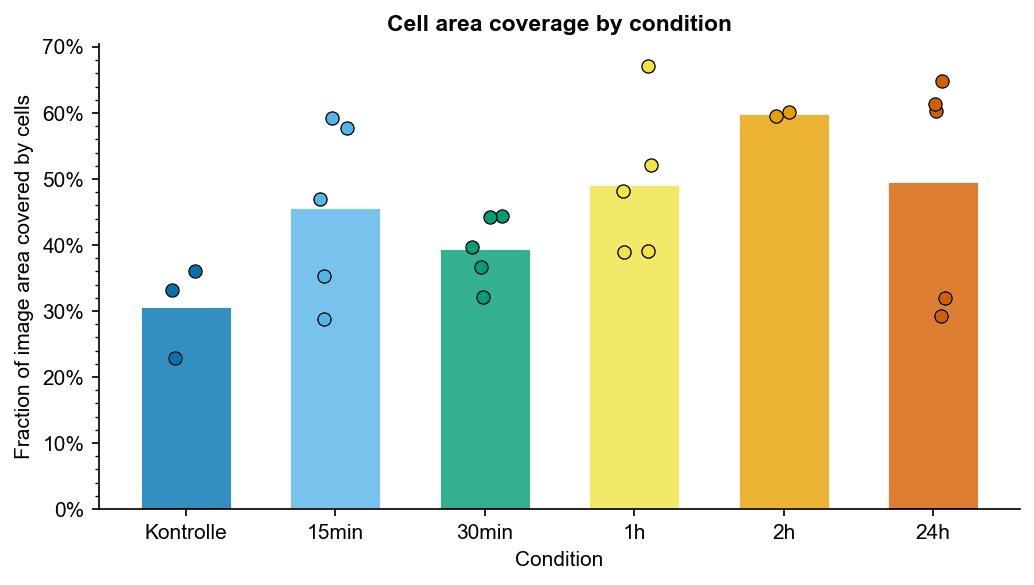
Area coverage
Controls: 23–36% of image area covered
Peaks at ~60–67% at 1h–2h; 24h range 29–65% (high variability).
CD11b mean intensity per cell
Median per-cell CD11b intensity ranges 43–92
a.u. across all 25 images, with no strong directional trend across conditions.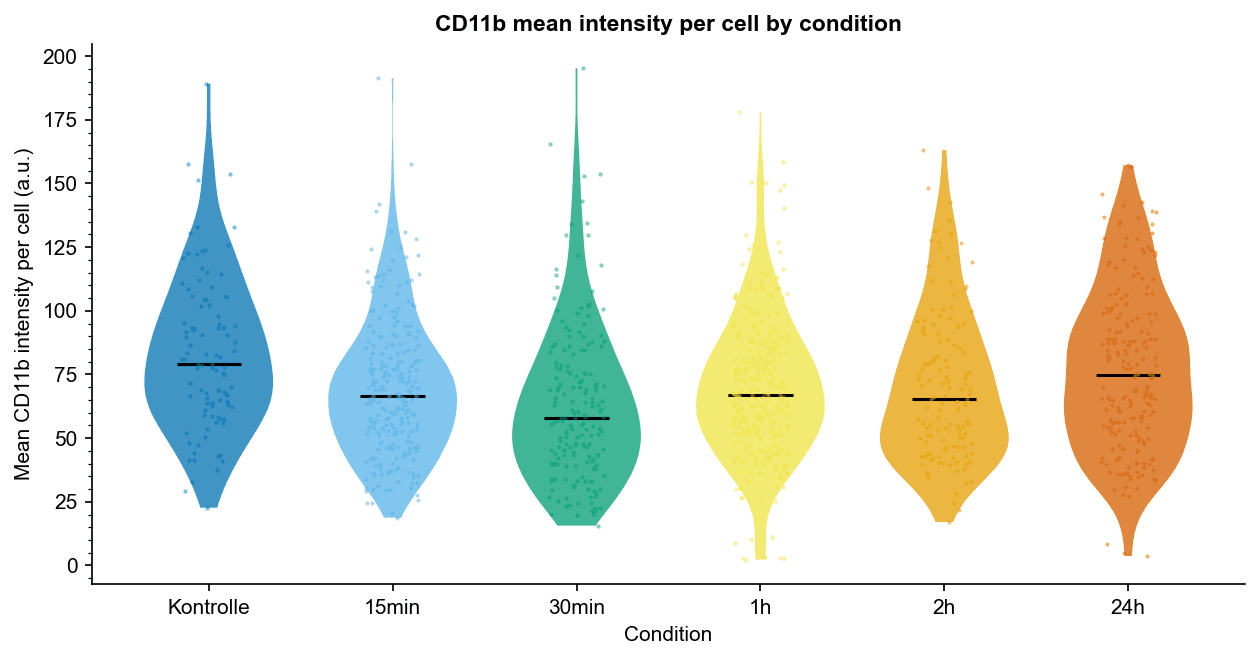
Statistical analysis across conditions
Kruskal-Wallis omnibus test
Endpoint | H | p | Significance |
|---|---|---|---|
Cell count | 13.82 | 0.017 | * |
Area fraction covered | 7.38 | 0.194 | ns |
Mean CD11b intensity ( | 7.99 | 0.157 | ns |
Cell count is the sole endpoint reaching statistical significance at the omnibus level (H = 13.82, p = 0.017).
Area fraction covered (H = 7.38, p = 0.194) and mean CD11b per cell (H = 7.99, p = 0.157) are non-significant.
Dunn's post-hoc (Bonferroni-corrected pairwise comparisons)
No individual pairwise comparison survives Bonferroni correction across any endpoint. The lowest-p pairs for cell count are:
Group 1 | Group 2 | p (Bonferroni) |
|---|---|---|
Kontrolle | 2h | 0.094 |
Kontrolle | 1h | 0.158 |
30min | 2h | 0.168 |
All remaining comparisons collapse to p = 1.000 after correction.
Cell count is the only endpoint with a statistically detectable omnibus effect across the six time points. The raw data show a clear directional trend: mean cell counts rise from ~34 (Kontrolle) to ~55–68 at 1h–2h, then partially return toward ~41 at 24h. However, this temporal pattern does not survive Bonferroni-corrected pairwise testing, which is expected given the small per-group replicate counts (n = 2–5): the conservative penalty absorbs biologically plausible effect sizes at this sample depth. This is consistent with macrophage recruitment dynamics where early time points reflect cellular influx before individual activation-state changes become detectable.
The 2h condition carries the most prominent apparent peak in both cell count (~67–71 cells per image) and area coverage (~60%); however, with only n = 2 replicates, this apparent peak is severely underpowered and must be treated as exploratory rather than confirmatory.
Area coverage and per-cell CD11b intensity show no statistically significant variation across conditions, which implies that the overall increase in CD11b signal over time is primarily a population-size effect — more cells accumulating — rather than per-cell transcriptional or translational upregulation of CD11b.
Next steps
Increase replication at 2h (and ideally all conditions to n ≥ 5) to provide adequate power for Bonferroni-corrected pairwise testing. With current n, FDR-based correction (Benjamini-Hochberg) would be less conservative and may reveal significant pairs — consider applying it as a sensitivity analysis.
Trend analysis: Given the clear directional increase in cell count, a non-parametric trend test (e.g., Jonckheere-Terpstra) across the ordered time points would be more statistically efficient than exhaustive pairwise comparisons.
Per-cell CD11b: Consider testing the full per-cell distribution (using
percell_all.csv, 1,154 cells) rather than per-image means, which would substantially increase statistical power for detecting intensity shifts.
