
This use case was co-created by academic researchers and Drylab. The full chat conversation demonstrates how researchers interact with Drylab to perform analyses, ask questions, and adapt workflows as new insights emerge.
We hope these examples inspire new approaches and possibilities in your own research.
Dataset Overview
Dataset: Bend3 and mLSEC Flow Cytometry Data
This dataset consists of four flow cytometry (.fcs) files representing two cell lines, Bend3 and mLSEC, under stained and unstained conditions. The analysis parses these files to evaluate cell vi- ability using the BV510 (Aqua Zombie) channel, establishing gating thresholds based on unstained controls to distinguish live cells from dead cells and autofluorescence.
Live Cell Gating and Viability Assessment
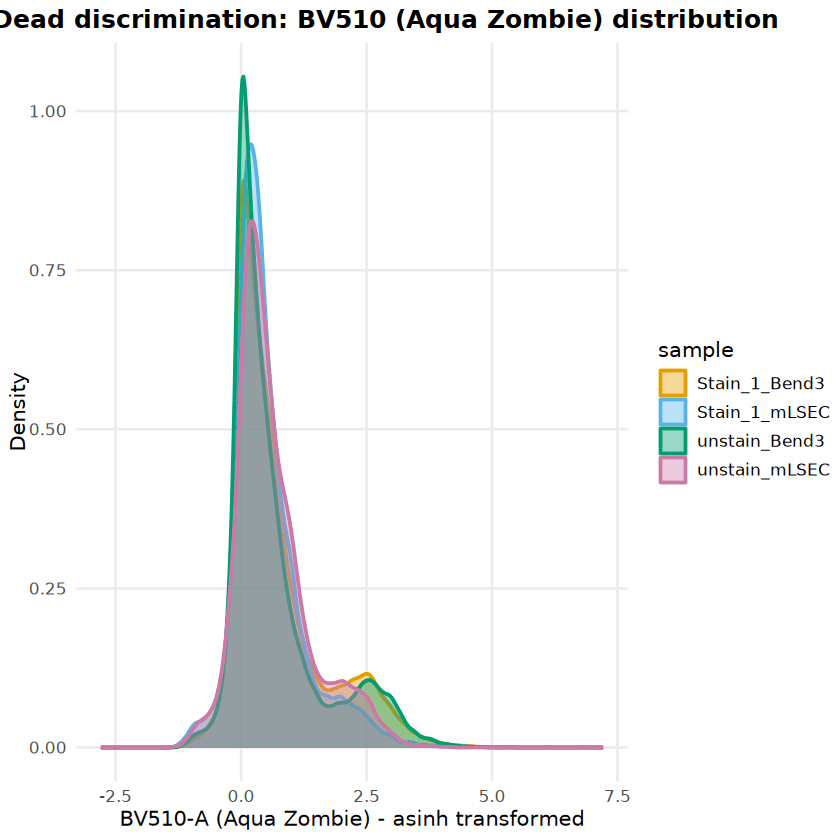
Analysis began with the assessment of cell viability for Bend3 and mLSEC endothelial cell lines. Live/dead discrimination was performed using Aqua Zombie viability dye (BV510-A channel). To account for cellular autofluorescence, particularly in the Bend3 line, gating thresholds were established using unstained controls (BV510-A < 2,826).
Both cell lines demonstrated exceptional viability (>99%), indicating high-quality sample prepara- tion. Bend3 cells exhibited a distinct autofluorescence shoulder in the violet spectrum, which was successfully excluded from the dead cell gate using the control-based thresholding approach. The FSC-A vs. BV510-A scatter plots below visualize the clean separation between the dominant live population (blue/low density) and the minimal dead cell population.
Endothelial Phenotype Characterization
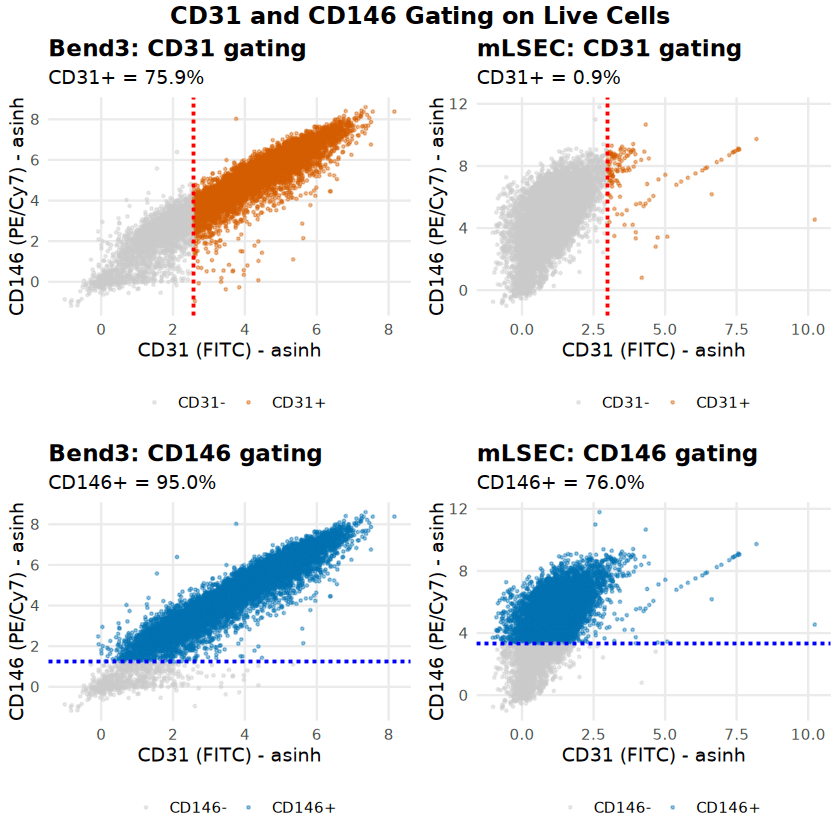
Following live cell gating, the endothelial phenotype was characterized using CD31 (PECAM-1) and CD146 (MCAM). Cell type-specific thresholds were set using unstained controls (99th percentile + 20% margin).
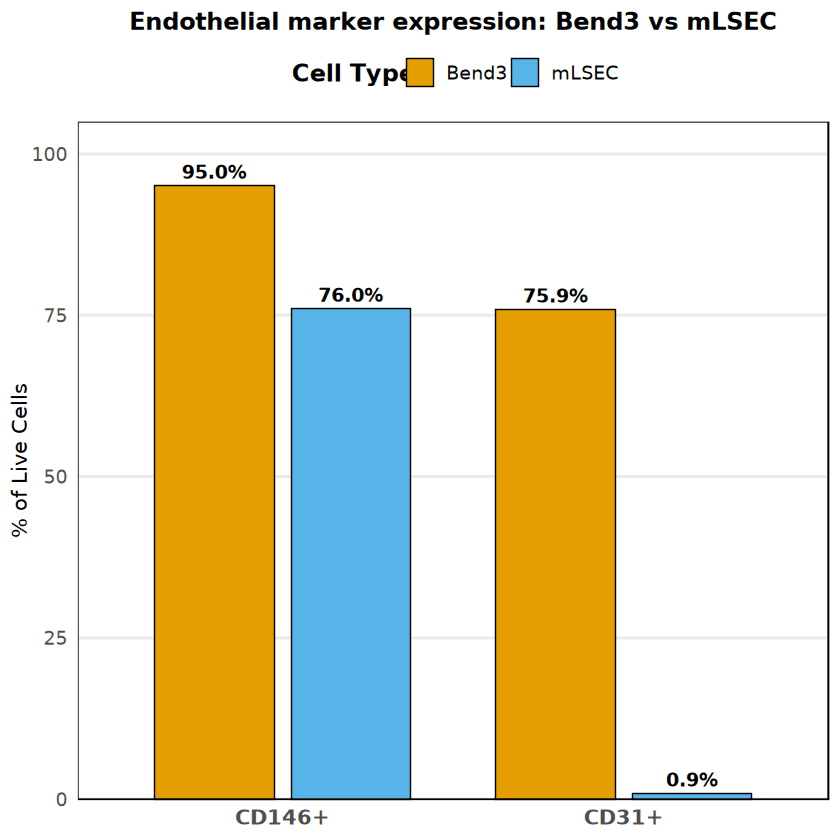
Bend3 cells displayed a robust, classical endothelial phenotype, with 75.88% CD31+ and 95.05% CD146+, forming a distinct double-positive population. In contrast, mLSEC cells exhibited a divergent phenotype: while they retained high CD146 expression (76.02%), they were nearly devoid of CD31 expression (0.86%). This suggests significant phenotypic drift or a specific sub-phenotype in the mLSEC culture.
ACKR1 Surface Expression Analysis
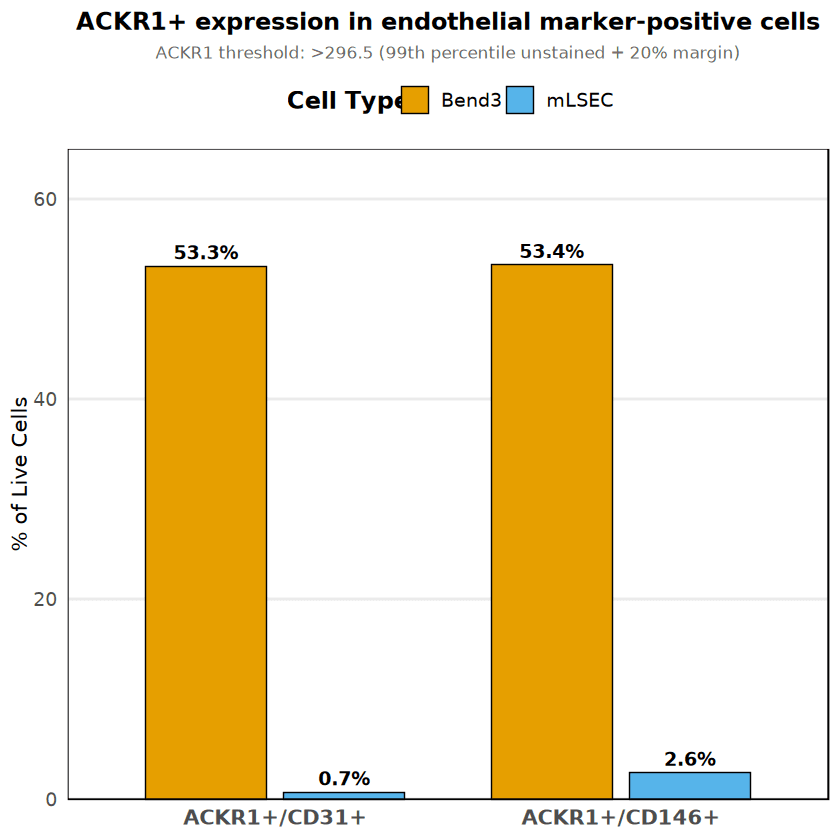
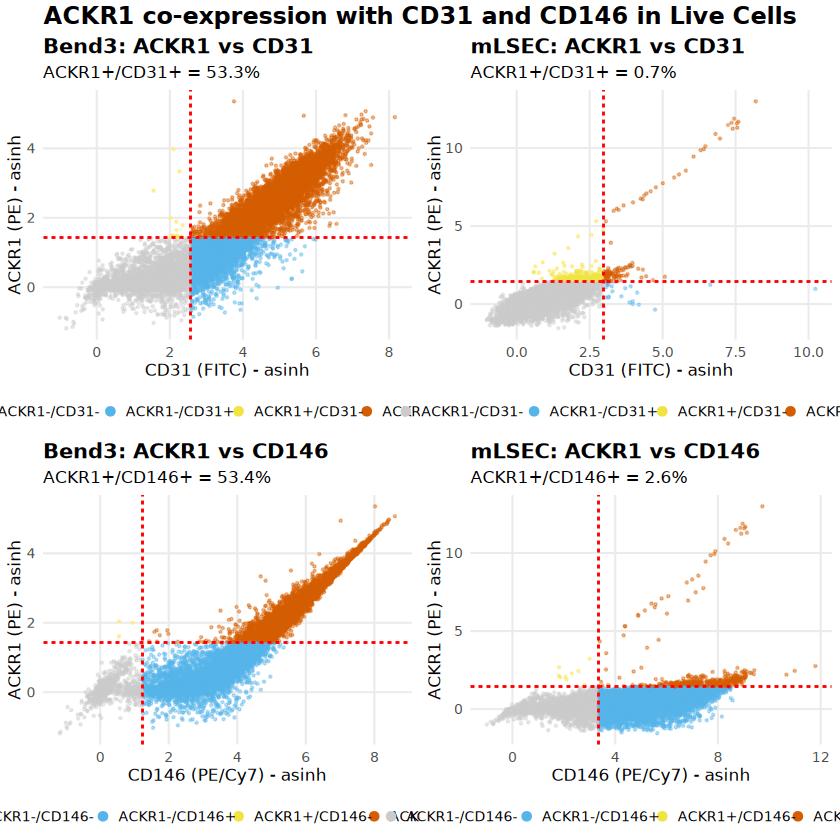
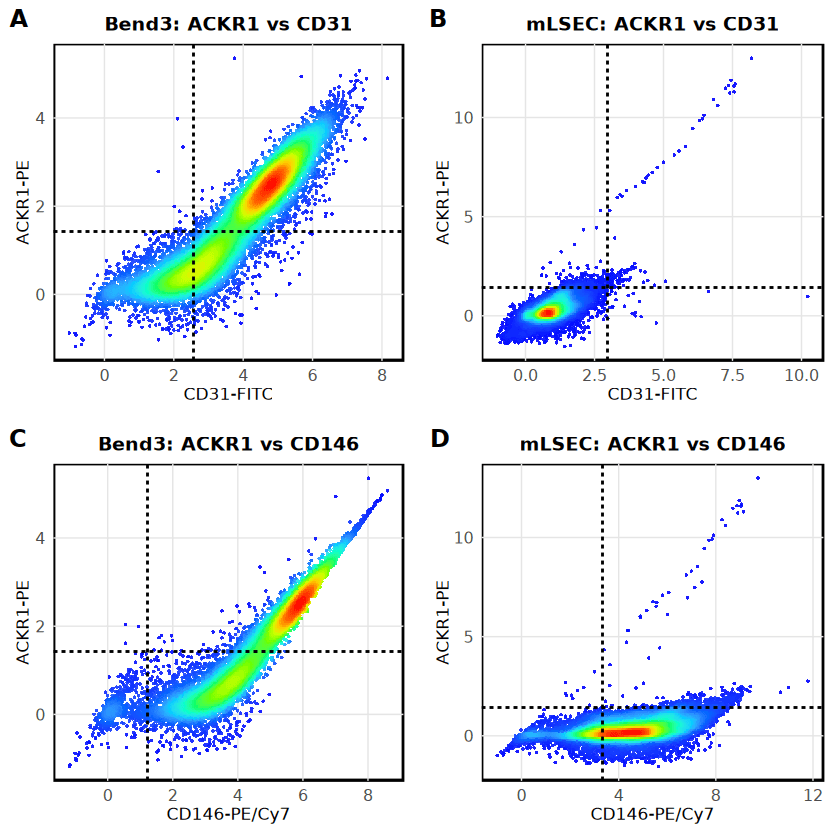
Expression of the Atypical Chemokine Receptor 1 (ACKR1) was analyzed within the live endothe- lial populations. The analysis revealed a striking difference between the two cell lines. Bend3 cells showed broad ACKR1 expression, with approximately 53% of the population co-expressing ACKR1 with endothelial markers. Conversely, mLSEC cells were predominantly ACKR1-negative (<3%).
To avoid potential spectral artifacts (discussed in the subsequent section), the primary visualization below utilizes CD31 (FITC) vs ACKR1 (PE), as these channels have minimal spectral overlap. This confirms that the ACKR1 signal in Bend3 cells is genuine and not a technical artifact.
Cell Type | ACKR1+/CD31+ (% of live) | ACKR1+/CD146+ (% of live) |
|---|---|---|
Bend3 | 53.28% (18,983 cells) | 53.41% (19,028 cells) |
mLSEC | 0.70% (106 cells) | 2.65% (399 cells) |
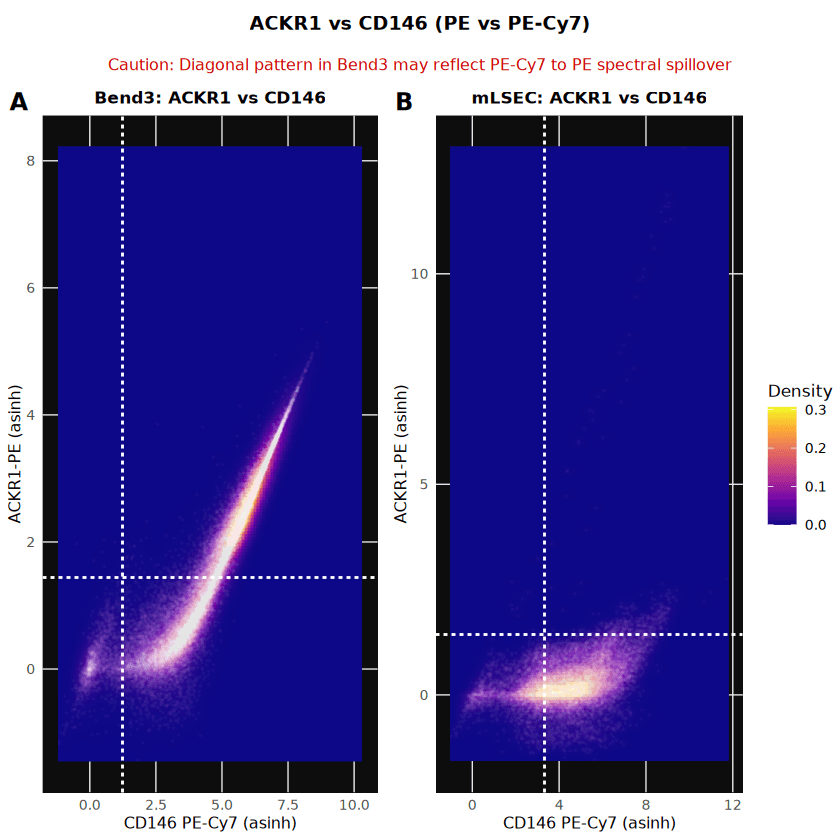
Technical Validation: Spectral Spillover Assessment
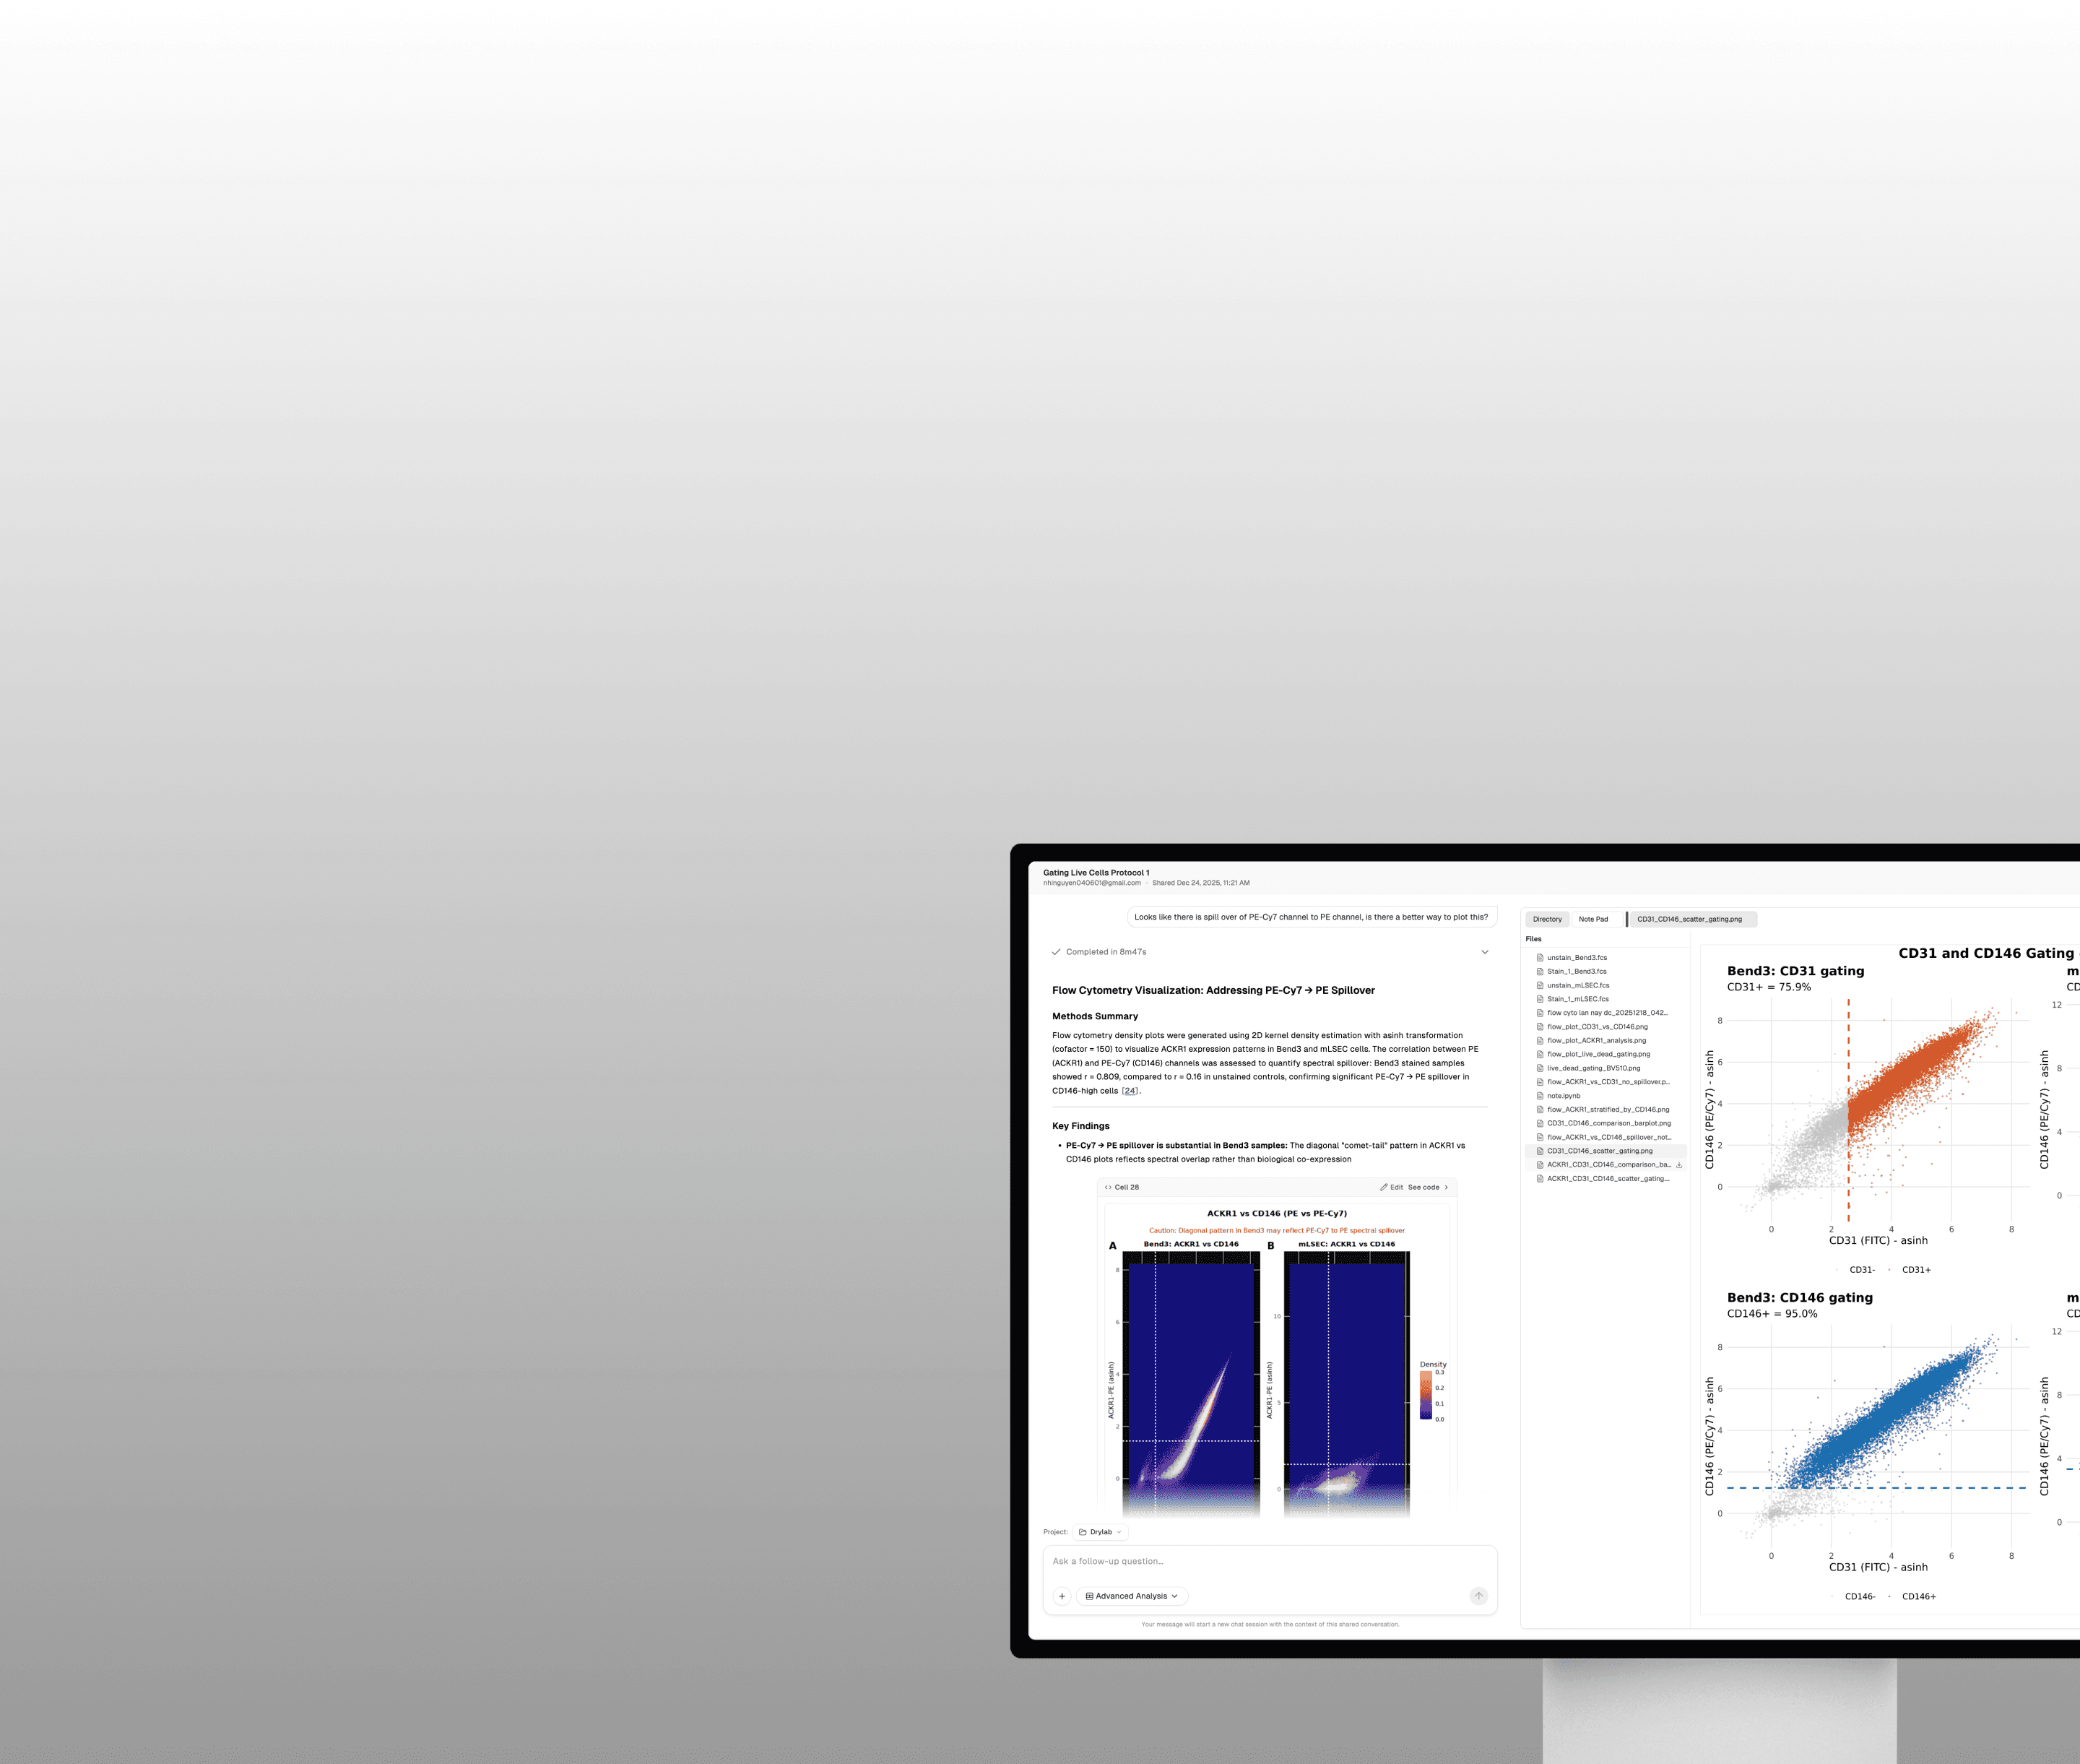
During the analysis of ACKR1 (PE channel) versus CD146 (PE-Cy7 channel), a strong correlation (r = 0.809) was observed in stained Bend3 samples compared to unstained controls. This "comet-tail" effect indicated significant spectral spillover from the bright CD146 signal into the ACKR1 detector.
To validate that the ACKR1 positivity reported in the previous section was biological and not purely technical, stratified histograms were generated. These plots decouple the channels and show that even within the CD146+ population, Bend3 cells exhibit a bimodal ACKR1 distribution (56.2% positive), whereas mLSEC CD146+ cells remain negative. This confirms the presence of a true ACKR1+ population in Bend3 cells despite the spillover artifact.
Appendix
This appendix contains the code cells and their outputs from the analysis notebook.
