

This use case was co-created by academic researchers and Drylab. The full chat conversation demonstrates how researchers interact with Drylab to perform analyses, ask questions, and adapt workflows as new insights emerge.
We hope these examples inspire new approaches and possibilities in your own research.
Methods Summary
Single-cell RNA-seq data from Bastidas-Ponce et al. (2019), "Comprehensive single cell mRNA profiling reveals a detailed roadmap for pancreatic endocrinogenesis" were analyzed using a Scanpy/scVelo/CellRank workflow. The dataset (GEO: GSE132188) comprises 3,696 cells from E15.5 mouse pancreas across 8 annotated cell types, with spliced and unspliced count layers (27,998 genes pre-filtering) .
Preprocessing: Genes were filtered (min 20 shared counts) and the top 2,000 highly variable genes retained; moments were computed with 30 PCs and 30 neighbors . RNA velocity: The scVelo dynamical model was fitted (recover_dynamics, mode='dynamical'), yielding velocity vectors and latent time estimates . CellRank fate mapping: A combined kernel (80% VelocityKernel + 20% ConnectivityKernel) was constructed . The GPCCA estimator identified 8 macrostates via Schur decomposition (21 components); 3 terminal states (Alpha, Beta, Epsilon) were set based on biological annotation, and fate probabilities were computed via absorption probability estimation . Lineage driver genes were identified by Pearson correlation of expression with fate probabilities . Gene expression trends were modeled with GAM along latent time, weighted by lineage-specific fate probabilities [,].
Key Findings
Differentiation Hierarchy and RNA Velocity
RNA velocity stream plots reveal a clear unidirectional differentiation hierarchy: Ductal progenitors -> Ngn3 low EP -> Ngn3 high EP -> Pre-endocrine -> terminal endocrine fates. Latent time progresses monotonically from 0.0 (Ductal) to 1.0 (mature endocrine)
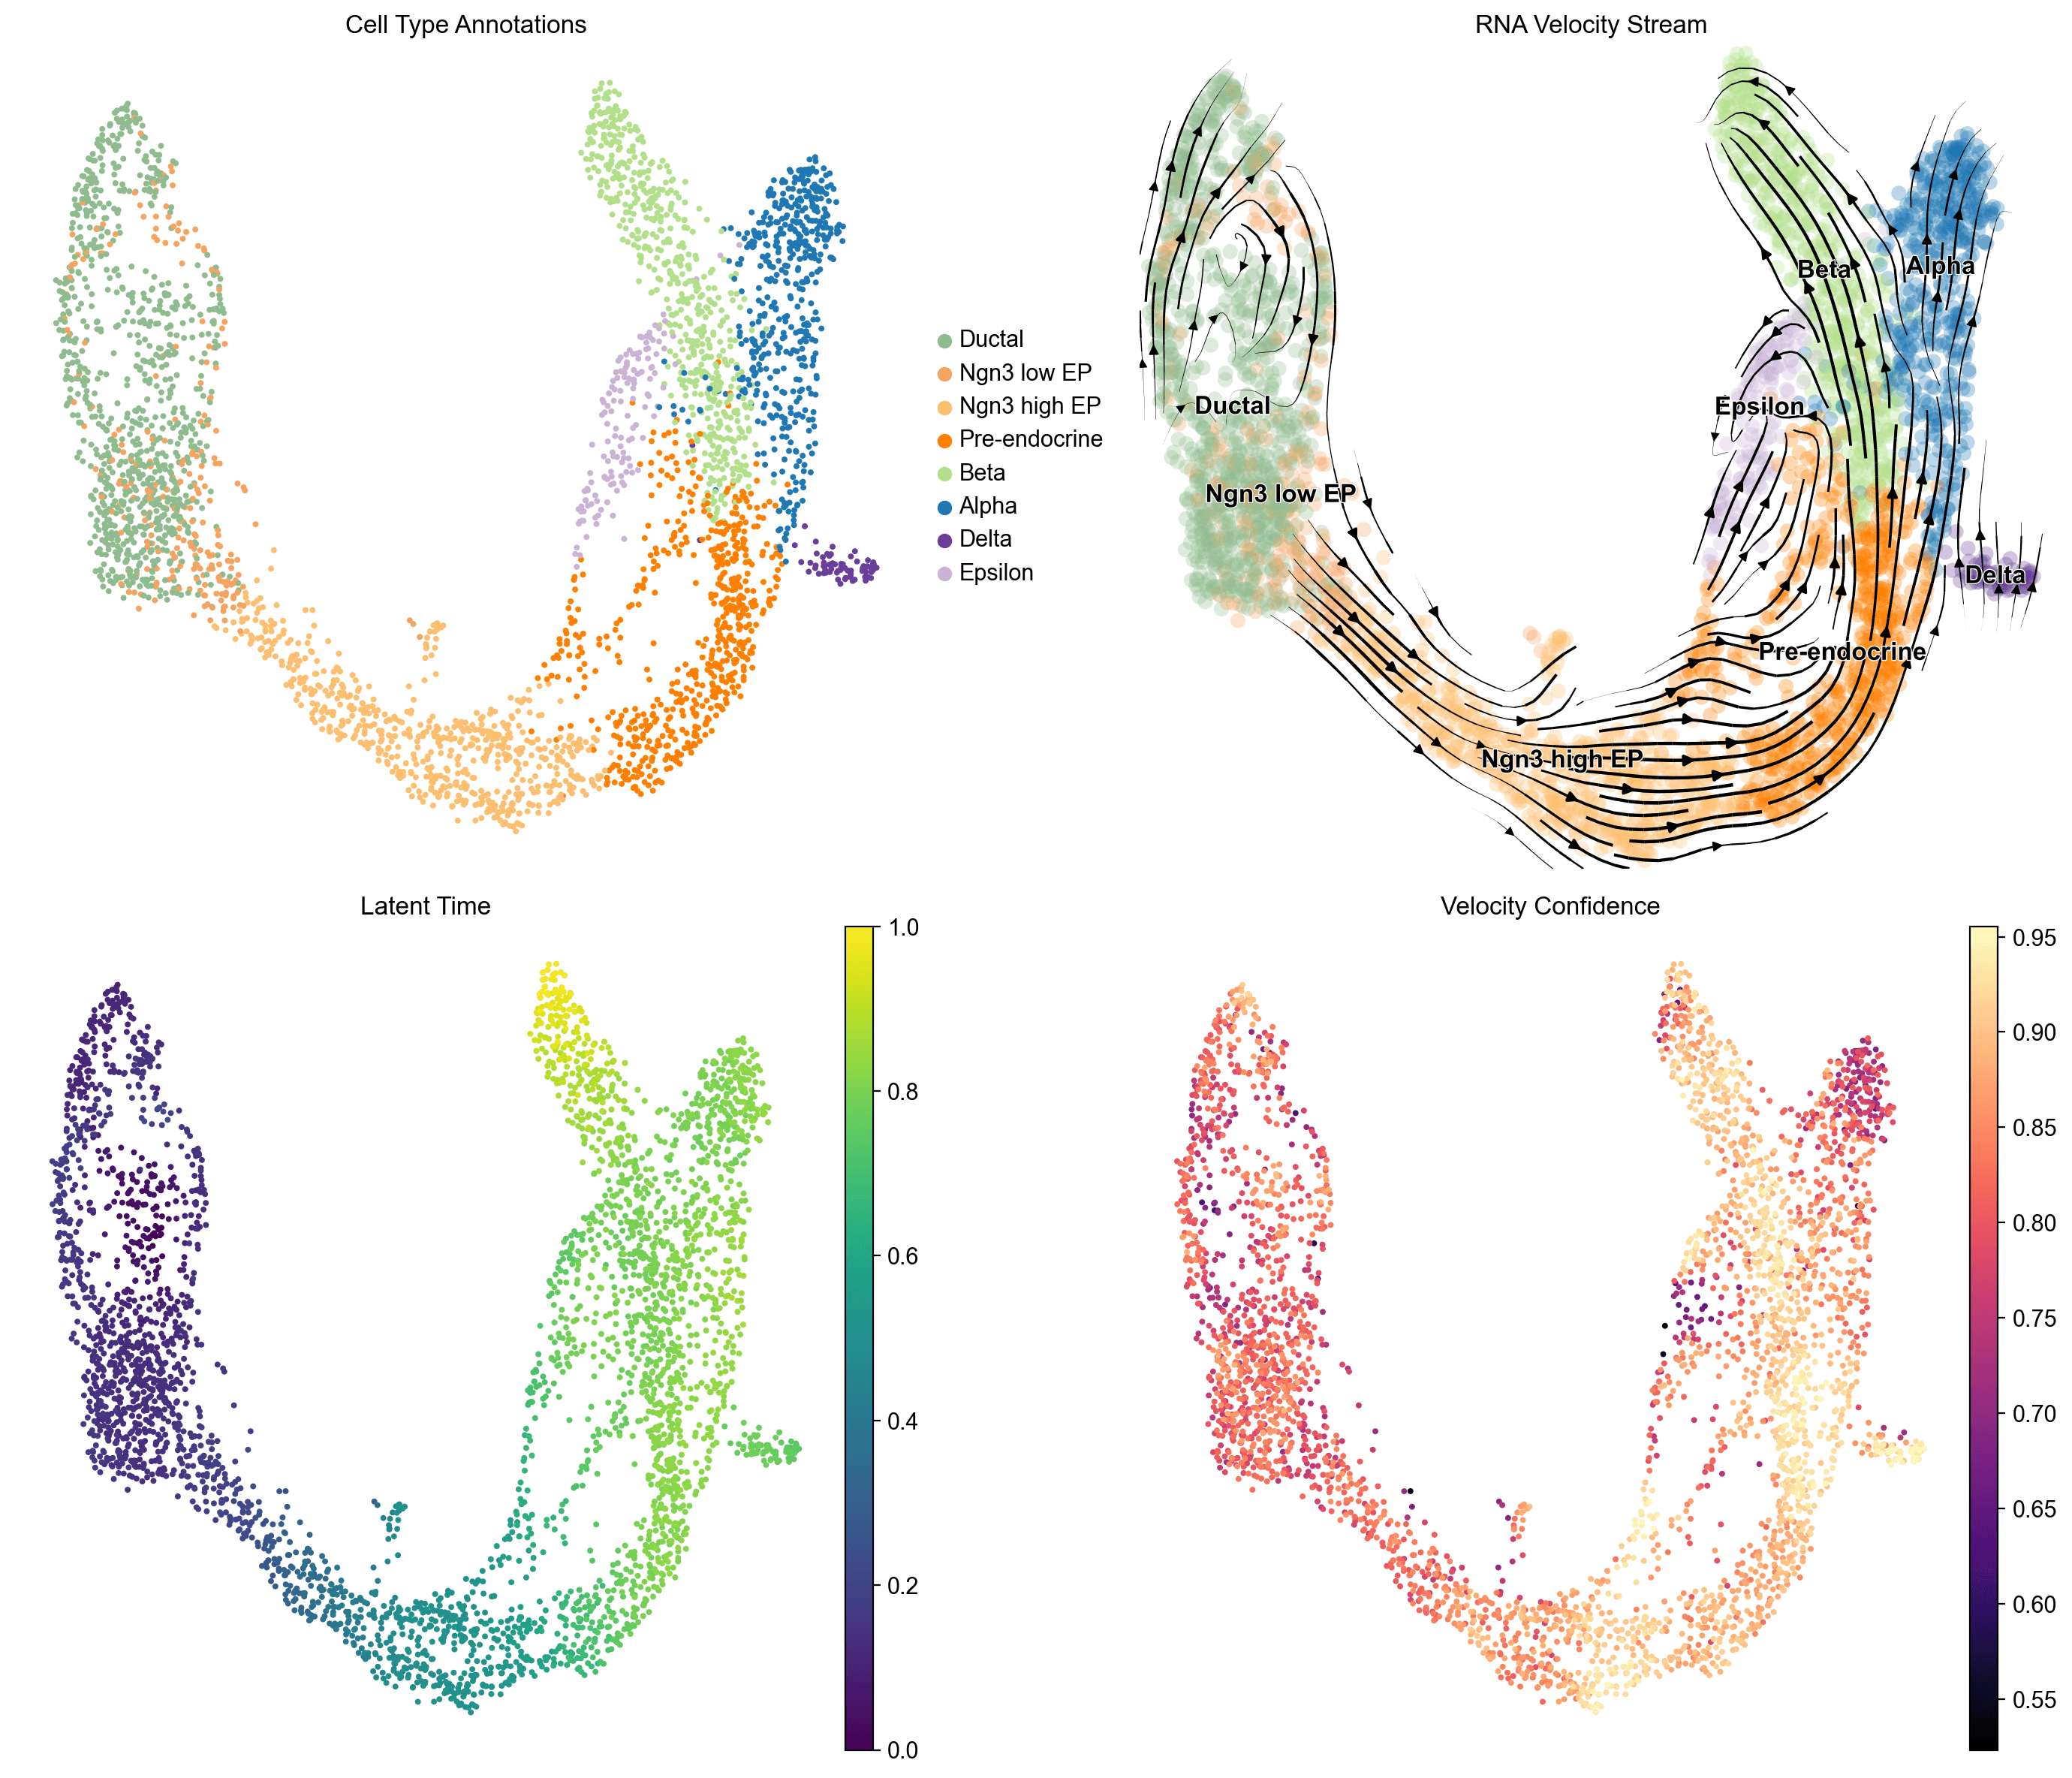
Velocity confidence is high (0.80-0.95) along the main differentiation trajectory, validating the directional signal .
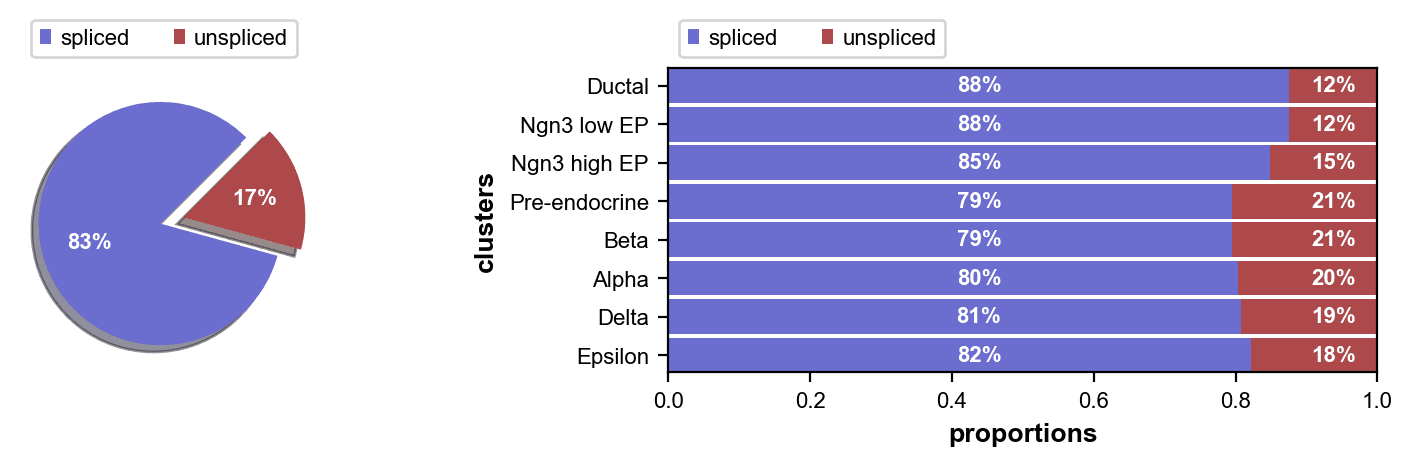
Unspliced fractions range from 12% (Ductal) to 21% (Pre-endocrine, Beta), with Pre-endocrine and Beta cells showing the highest transcriptional turnover rates
Terminal States and Fate Probabilities
GPCCA eigenvalue spectrum shows a gap after index 5-6, supporting 8 macrostates that map cleanly to known cell populations: 4 Ductal sub-states, Ngn3 low EP, Alpha (30 pure Alpha cells), Beta (30 pure Beta cells), and Epsilon (30 pure Epsilon cells) [,].
Delta cells (n=70) were not resolved as a separate macrostate due to their small population size and transcriptomic proximity to the Beta lineage.
Terminal State
Mean Fate Prob (self)
Mean Fate Prob (Delta toward it)
Beta
0.922
0.744
Epsilon
0.893
0.172
Alpha
0.541
0.084
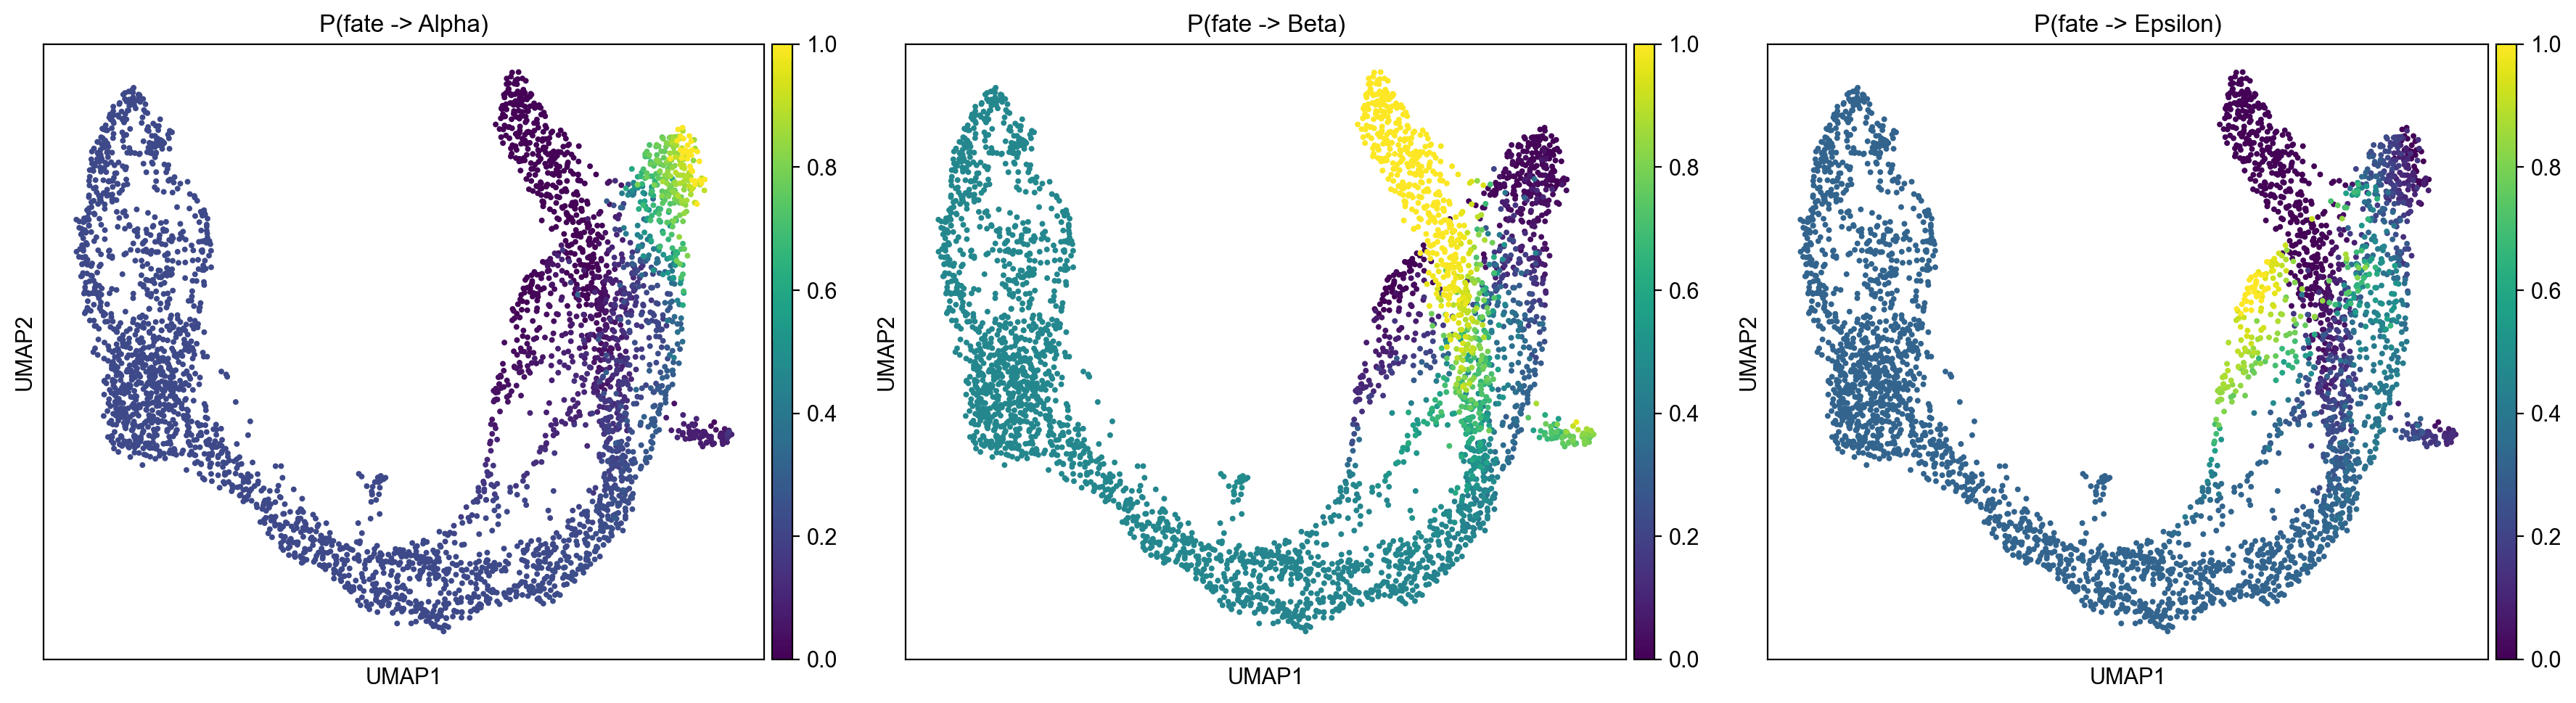
Beta cells exhibit the strongest lineage commitment (P=0.922), indicating a highly deterministic differentiation program.
Delta cells are predominantly assigned Beta fate (P=0.744), consistent with their known developmental proximity and shared Pax4 expression.
Pre-endocrine cells are genuinely multipotent, with balanced probabilities across all three fates (P(Beta)=0.477, P(Epsilon)=0.328, P(Alpha)=0.195) .
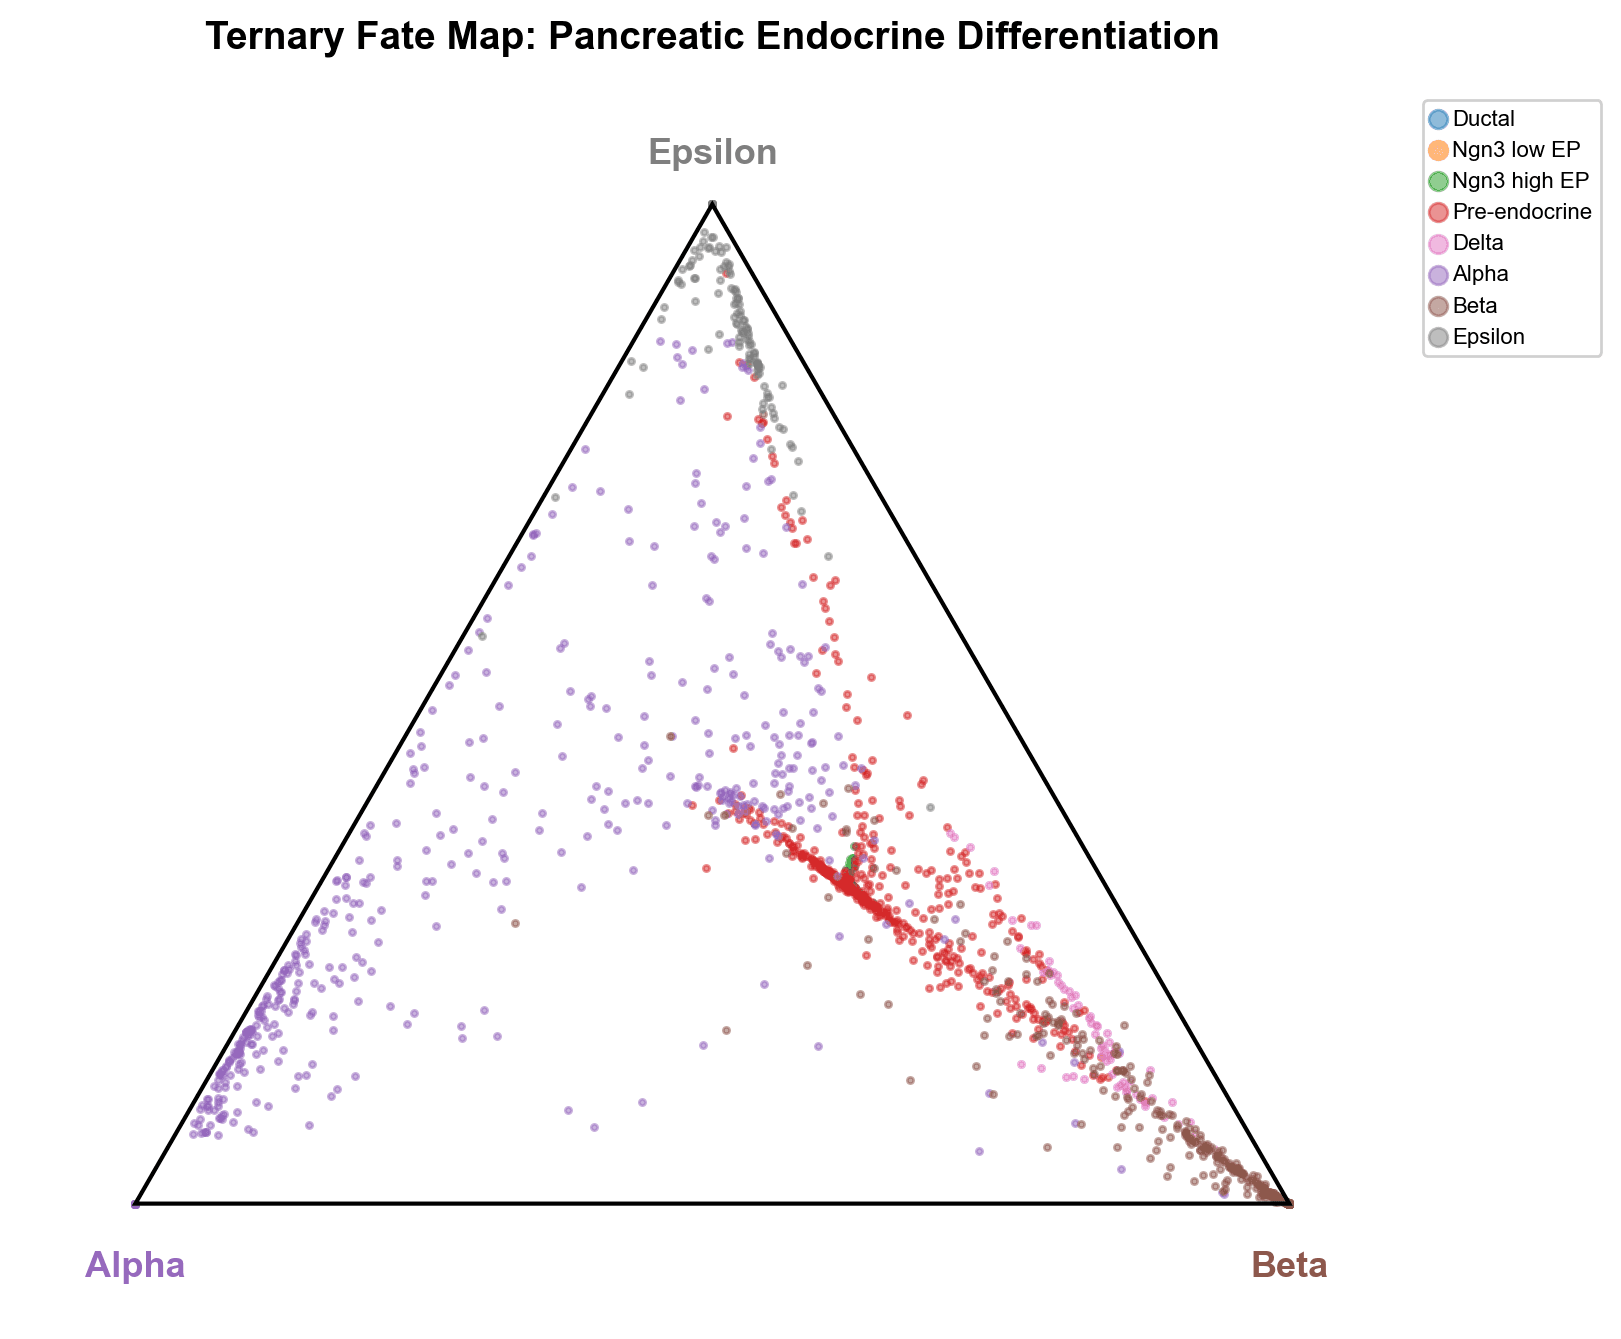
Ternary Fate Map Projection
The simplex projection places mature Alpha, Beta, and Epsilon cells at their respective vertices, while Pre-endocrine cells form a central stream that branches toward each terminal fate. Delta cells cluster near the Beta vertex along the Alpha-Beta edge, reinforcing their Beta-lineage proximity
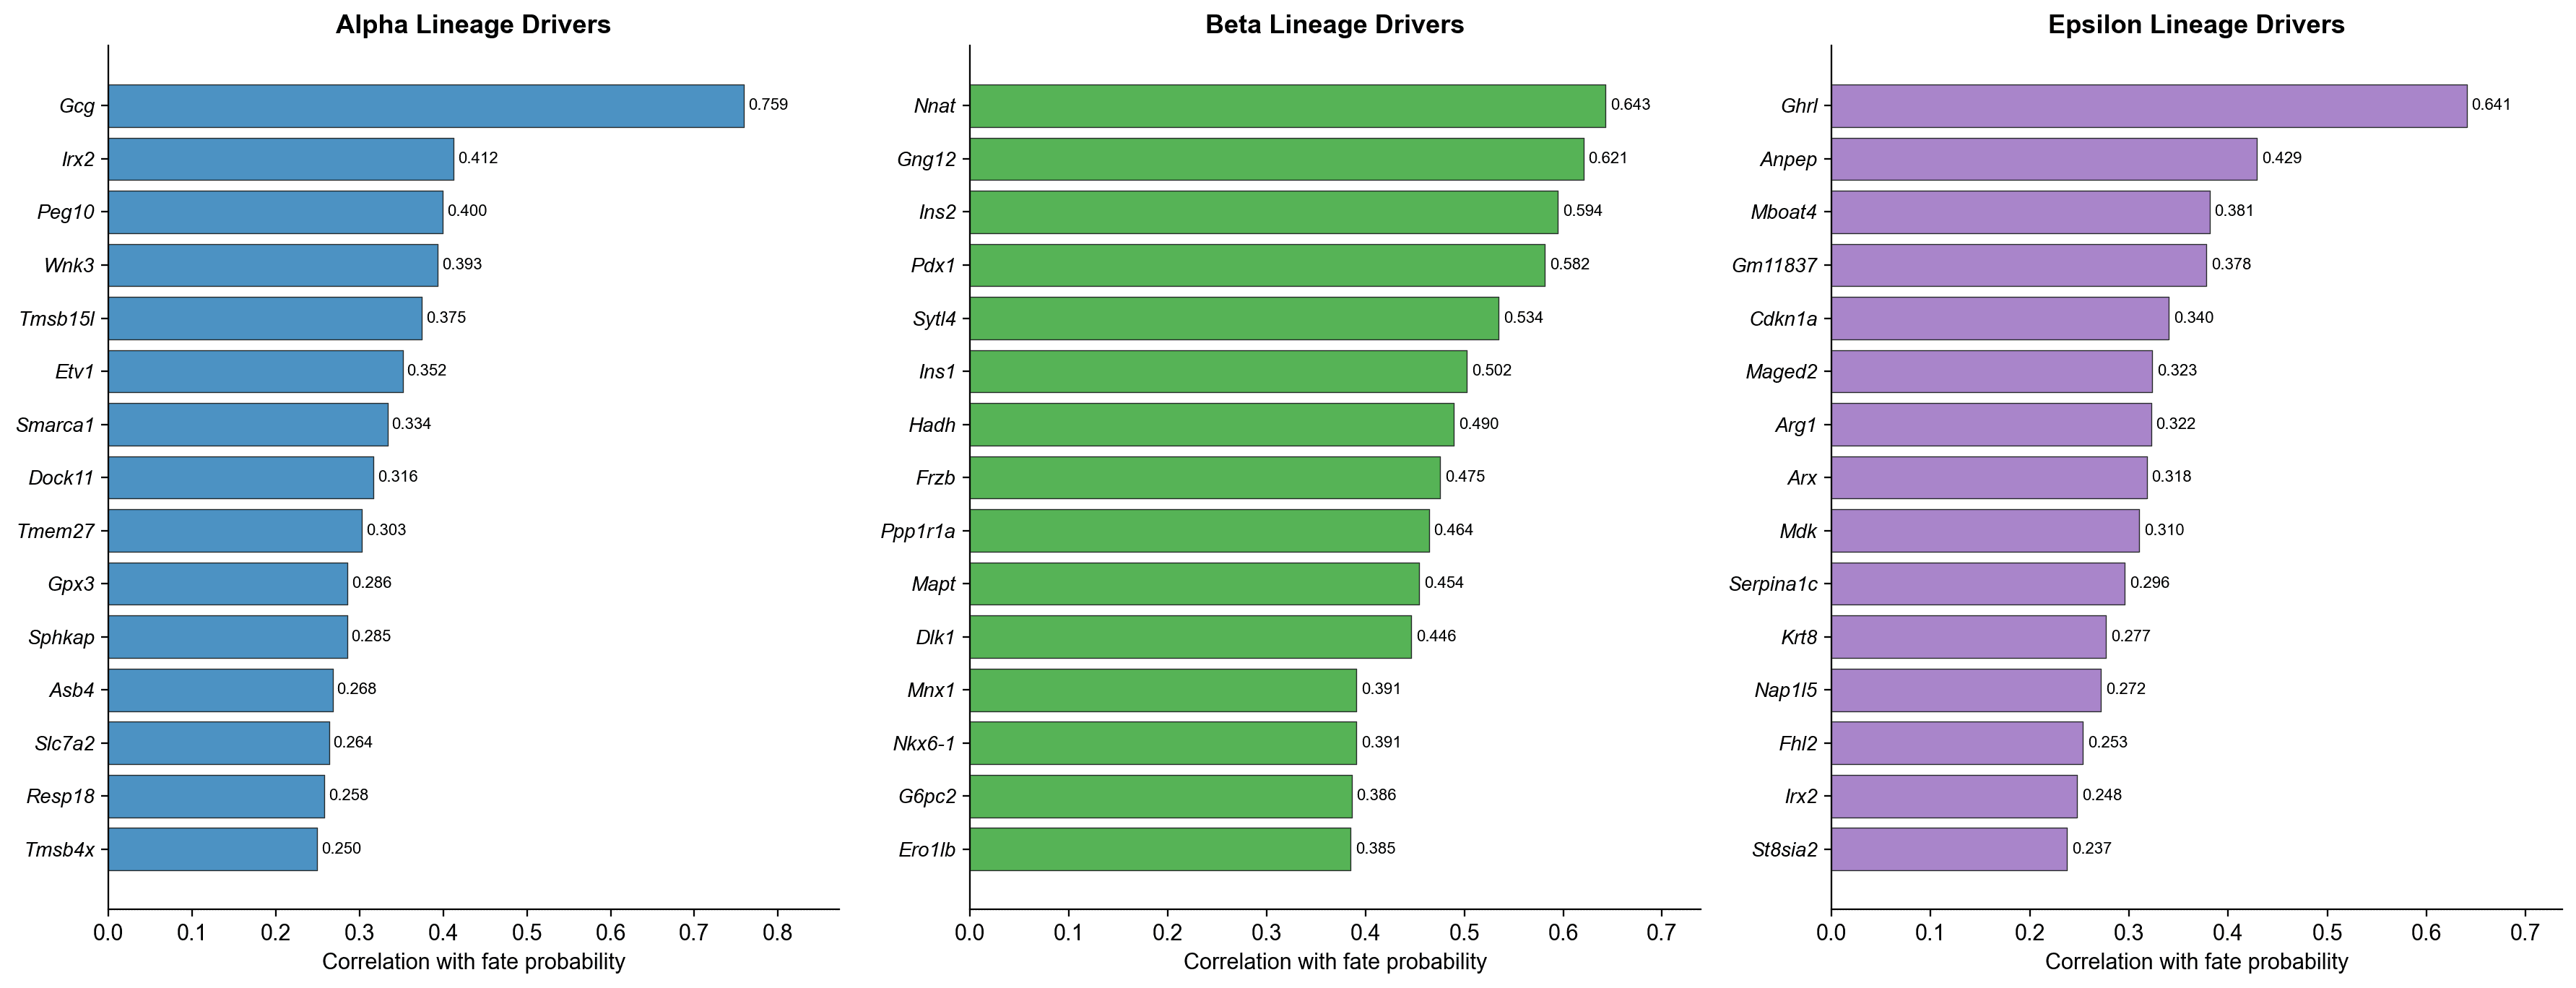
Lineage Driver Genes
All top-ranked lineage drivers match well-established pancreatic endocrine biology (all q-values effectively 0) :
Lineage | Top Drivers (correlation) | Biological Significance |
|---|---|---|
Alpha | Gcg (r=0.759), Irx2 (r=0.412), Peg10 (r=0.400), Etv1 (r=0.352) | Glucagon is the defining Alpha hormone; Irx2 is a known Alpha cell TF |
Beta | Nnat (r=0.643), Ins2 (r=0.594), Pdx1 (r=0.582), Nkx6-1 (r=0.391) | Insulin genes and Pdx1/Nkx6-1 are canonical Beta identity factors |
Epsilon | Ghrl (r=0.641), Anpep (r=0.429), Mboat4 (r=0.381), Arx (r=0.318) | Ghrelin is the Epsilon hormone; Mboat4 (GOAT) is required for ghrelin acylation |
Gene Expression Dynamics Along Pseudotime
Neurog3 displays a characteristic transient pulse at mid-pseudotime (latent time ~0.4-0.6), marking the endocrine progenitor specification window; this peak is shared across all three lineages, confirming Neurog3 as a common endocrine gateway factor
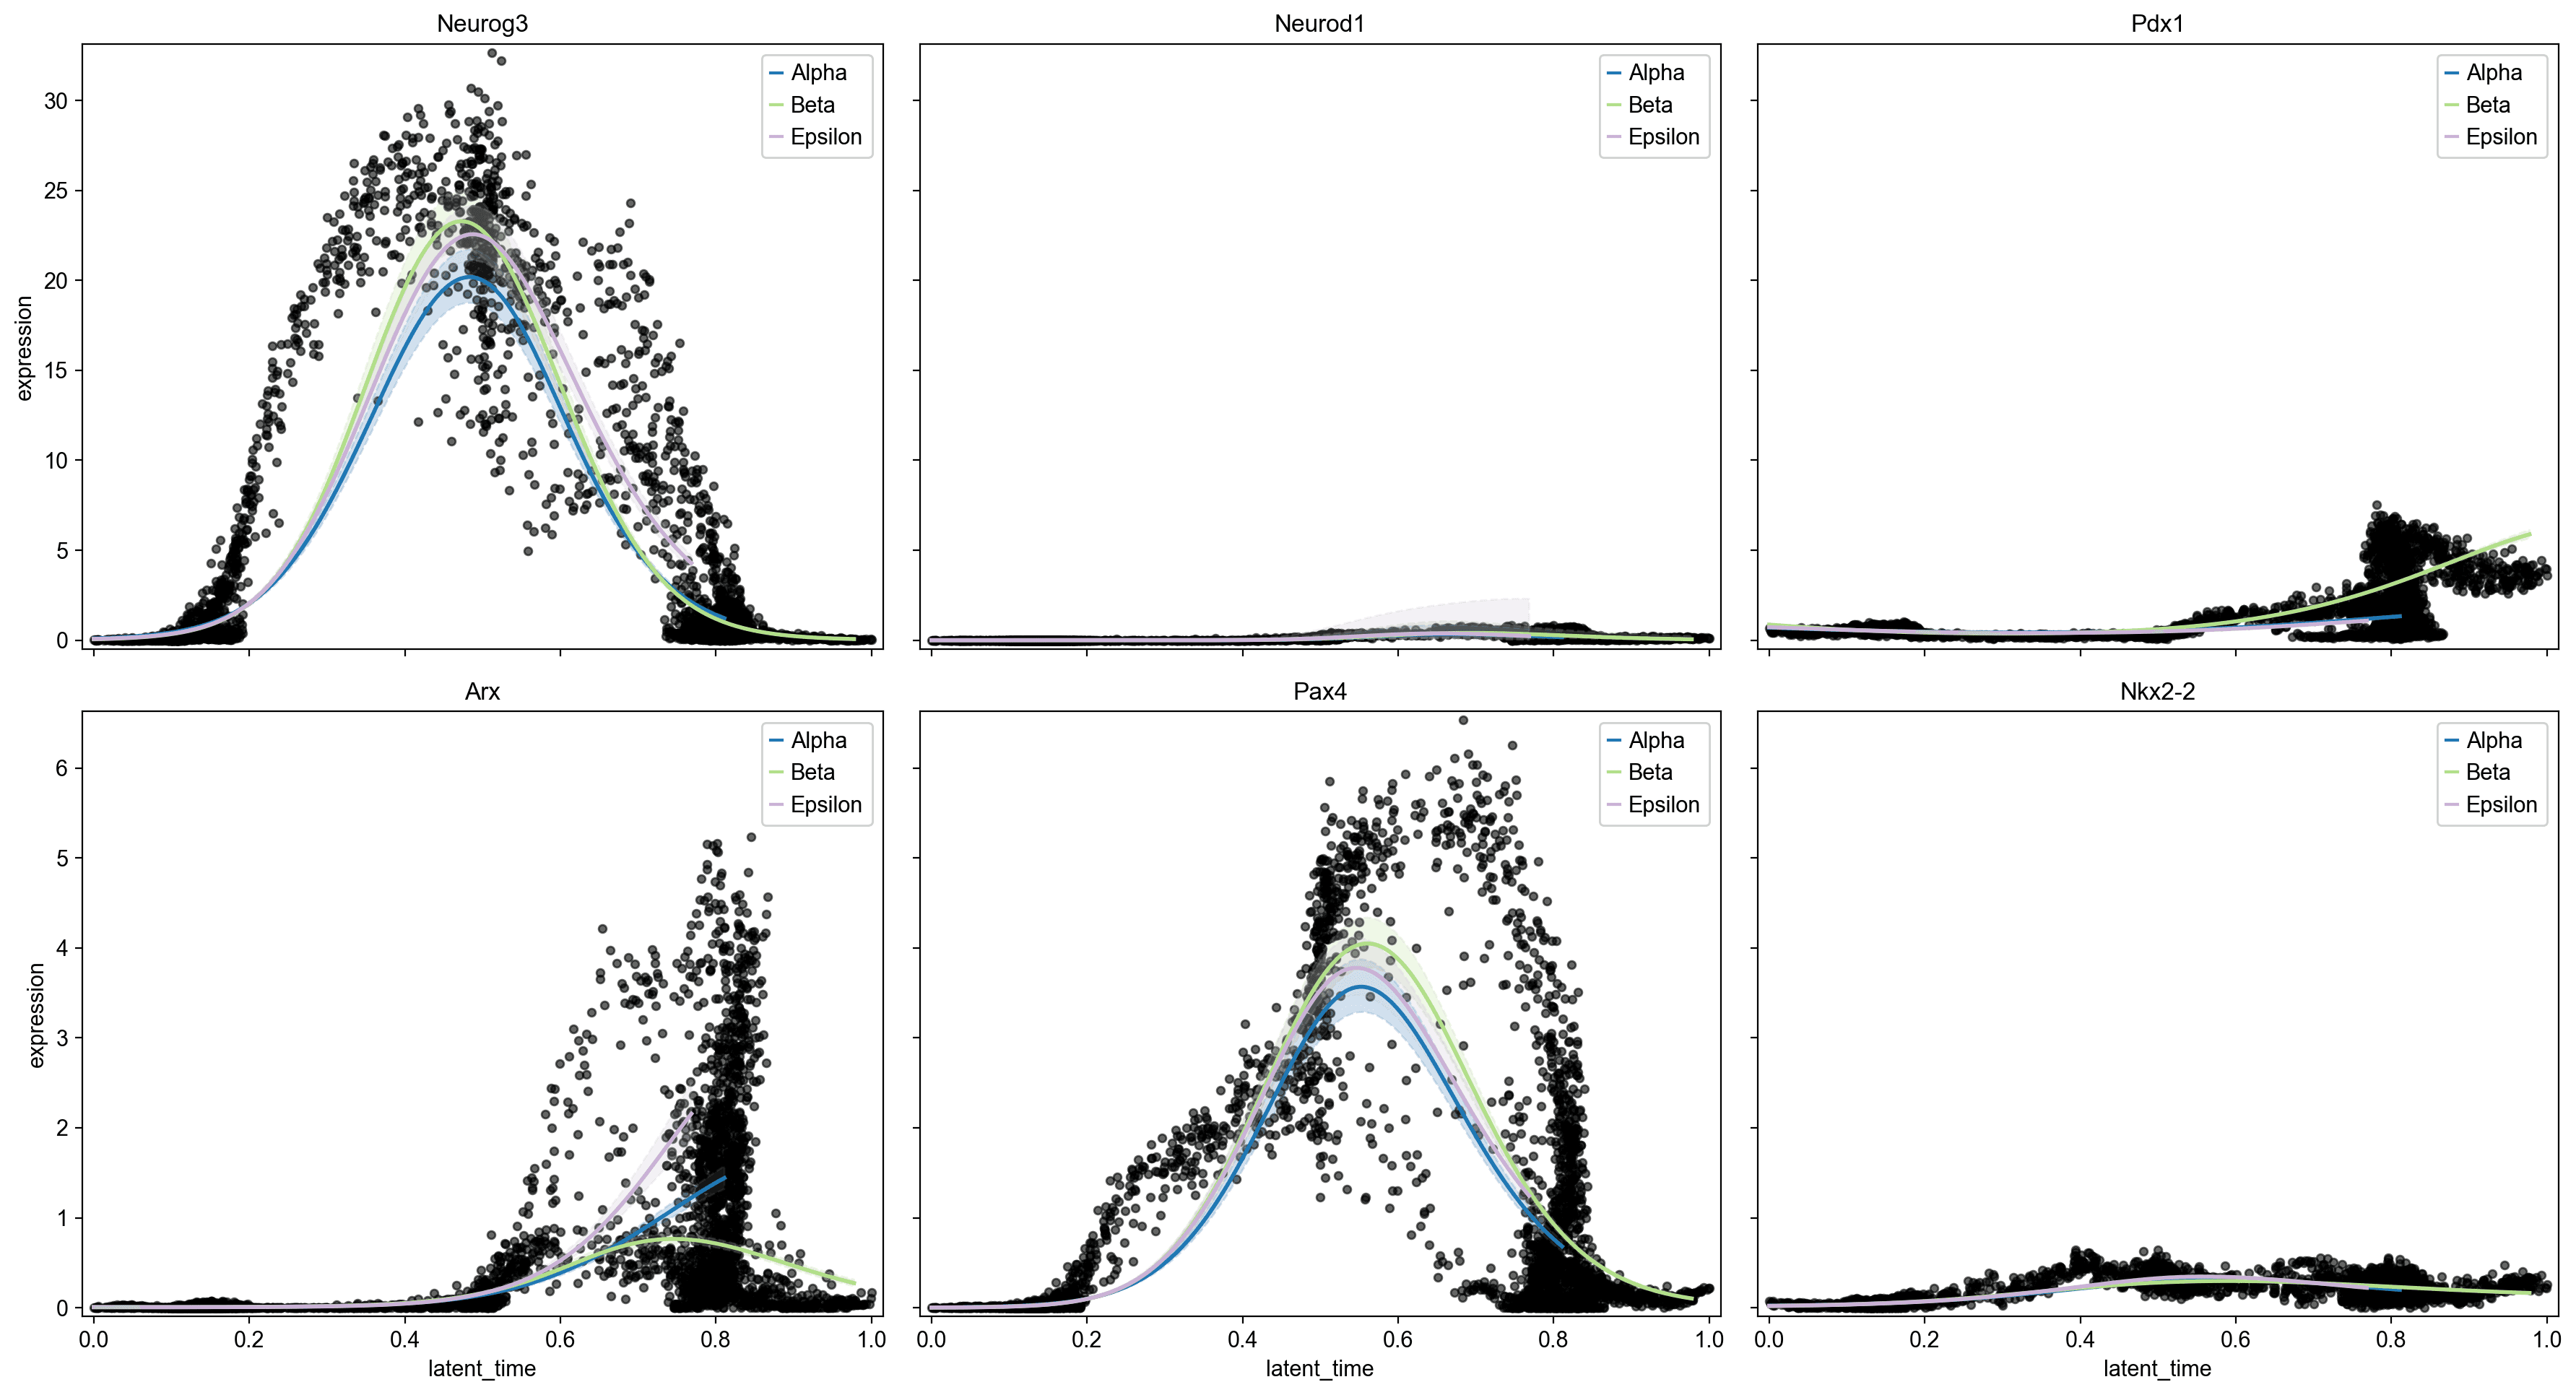
Ins1/Ins2 progressively increase along the Beta lineage trajectory, reaching maximal expression at late pseudotime (>0.85) .
Ghrl shows Epsilon-specific upregulation in the latent time 0.65-0.85 window .
Arx shows Alpha-lineage-specific late upregulation (latent time >0.6), consistent with its role as an Alpha cell fate determinant; the Alpha trend line diverges markedly from Beta/Epsilon at this point .
Pax4 peaks co-temporally with Neurog3 and is expressed across multiple lineages before resolving, consistent with its known role in the Beta/Delta fate decision .
Interpretation
This analysis provides a comprehensive probabilistic reconstruction of pancreatic endocrine cell fate decisions using the CellRank framework. Several findings merit emphasis:
The differentiation is hierarchical and largely irreversible. RNA velocity vectors are consistently directed from progenitors toward terminal states, with no evidence of retrograde flow. The latent time gradient is smooth and monotonic, supporting a well-ordered temporal progression through Ductal, Ngn3 low/high EP, Pre-endocrine, and terminal endocrine states.
Beta cell fate commitment is the strongest among all endocrine lineages. The mean fate probability of 0.922 for Beta cells, compared to 0.541 for Alpha cells, suggests that Beta specification involves a more decisive molecular switch. This may reflect the strong positive feedback loop involving Pdx1, Nkx6-1, and insulin gene activation.
Delta cells are transcriptomically closest to the Beta lineage. The ternary fate projection and absorption probabilities consistently place Delta cells near the Beta vertex (P=0.744). This is biologically consistent with the known role of Pax4 in the Beta/Delta fate decision and supports a model where Delta cells arise from a late-branching event within the Beta-committed lineage.
The Neurog3 pulse defines a critical specification window. The transient Neurog3 expression at mid-pseudotime, followed by divergent expression of Arx (Alpha) and Pax4 (Beta/Delta), recapitulates the well-established model of endocrine specification where Neurog3 activates downstream transcription factors that resolve into lineage-specific programs.
Limitations: Delta cells (n=70) could not be resolved as an independent terminal state. The GAM trend for Gcg in the Alpha lineage failed to converge, likely because Alpha cells are concentrated at the extreme end of latent time with insufficient intermediate sampling for smooth curve fitting. The analysis uses a single timepoint (E15.5); incorporating the full E12.5-E15.5 time course from the original study would provide more comprehensive temporal coverage.
Recommended Next Steps
Include Delta as a terminal state by either increasing macrostate resolution (n_states > 8) or manually defining Delta cells as an additional terminal state, enabling independent Delta lineage analysis.
Apply CellRank 2's RealTimeKernel to integrate the multi-timepoint data (E12.5-E15.5) from the full GSE132188 dataset using optimal transport, which would capture temporal dynamics that single-snapshot velocity analysis cannot resolve.
Perform differential gene expression between pre-endocrine cells with high vs. low fate probabilities for each lineage (e.g., "Beta-primed" vs. "Alpha-primed" pre-endocrine cells) to identify early lineage priming signatures.
Cross-validate with the CellRank PseudotimeKernel as an alternative to the VelocityKernel, to assess whether fate probability estimates are robust to the choice of directionality signal.
Cluster gene expression trends (using
cr.pl.cluster_trends) to identify co-regulated gene modules along each lineage, which may reveal novel regulatory programs driving endocrine fate decisions.
