This use case was co-created by academic researchers and Drylab. The full chat conversation demonstrates how researchers interact with Drylab to perform analyses, ask questions, and adapt workflows as new insights emerge.
We hope these examples inspire new approaches and possibilities in your own research.
Dataset Overview
GSE201610: 10x Genomics Visium spatial transcriptomics of mouse brain from a spatial object recognition (SOR) training experiment
Attribute | Details |
|---|---|
Organism | Mus musculus (mouse) |
Tissue | Brain sagittal sections |
Platform | 10x Visium + Illumina NovaSeq 6000 |
Samples | 6 total: 3 Home-cage controls (HC1–HC3) + 3 SOR-trained (SOR1–SOR3) |
Spots/Sample | 2,550–2,936 per section |
Genes | 32,285 total |
GEO Accession | GSE201610 |
Cell Types | Not pre-annotated; identified through unsupervised analysis |
Analyses Performed
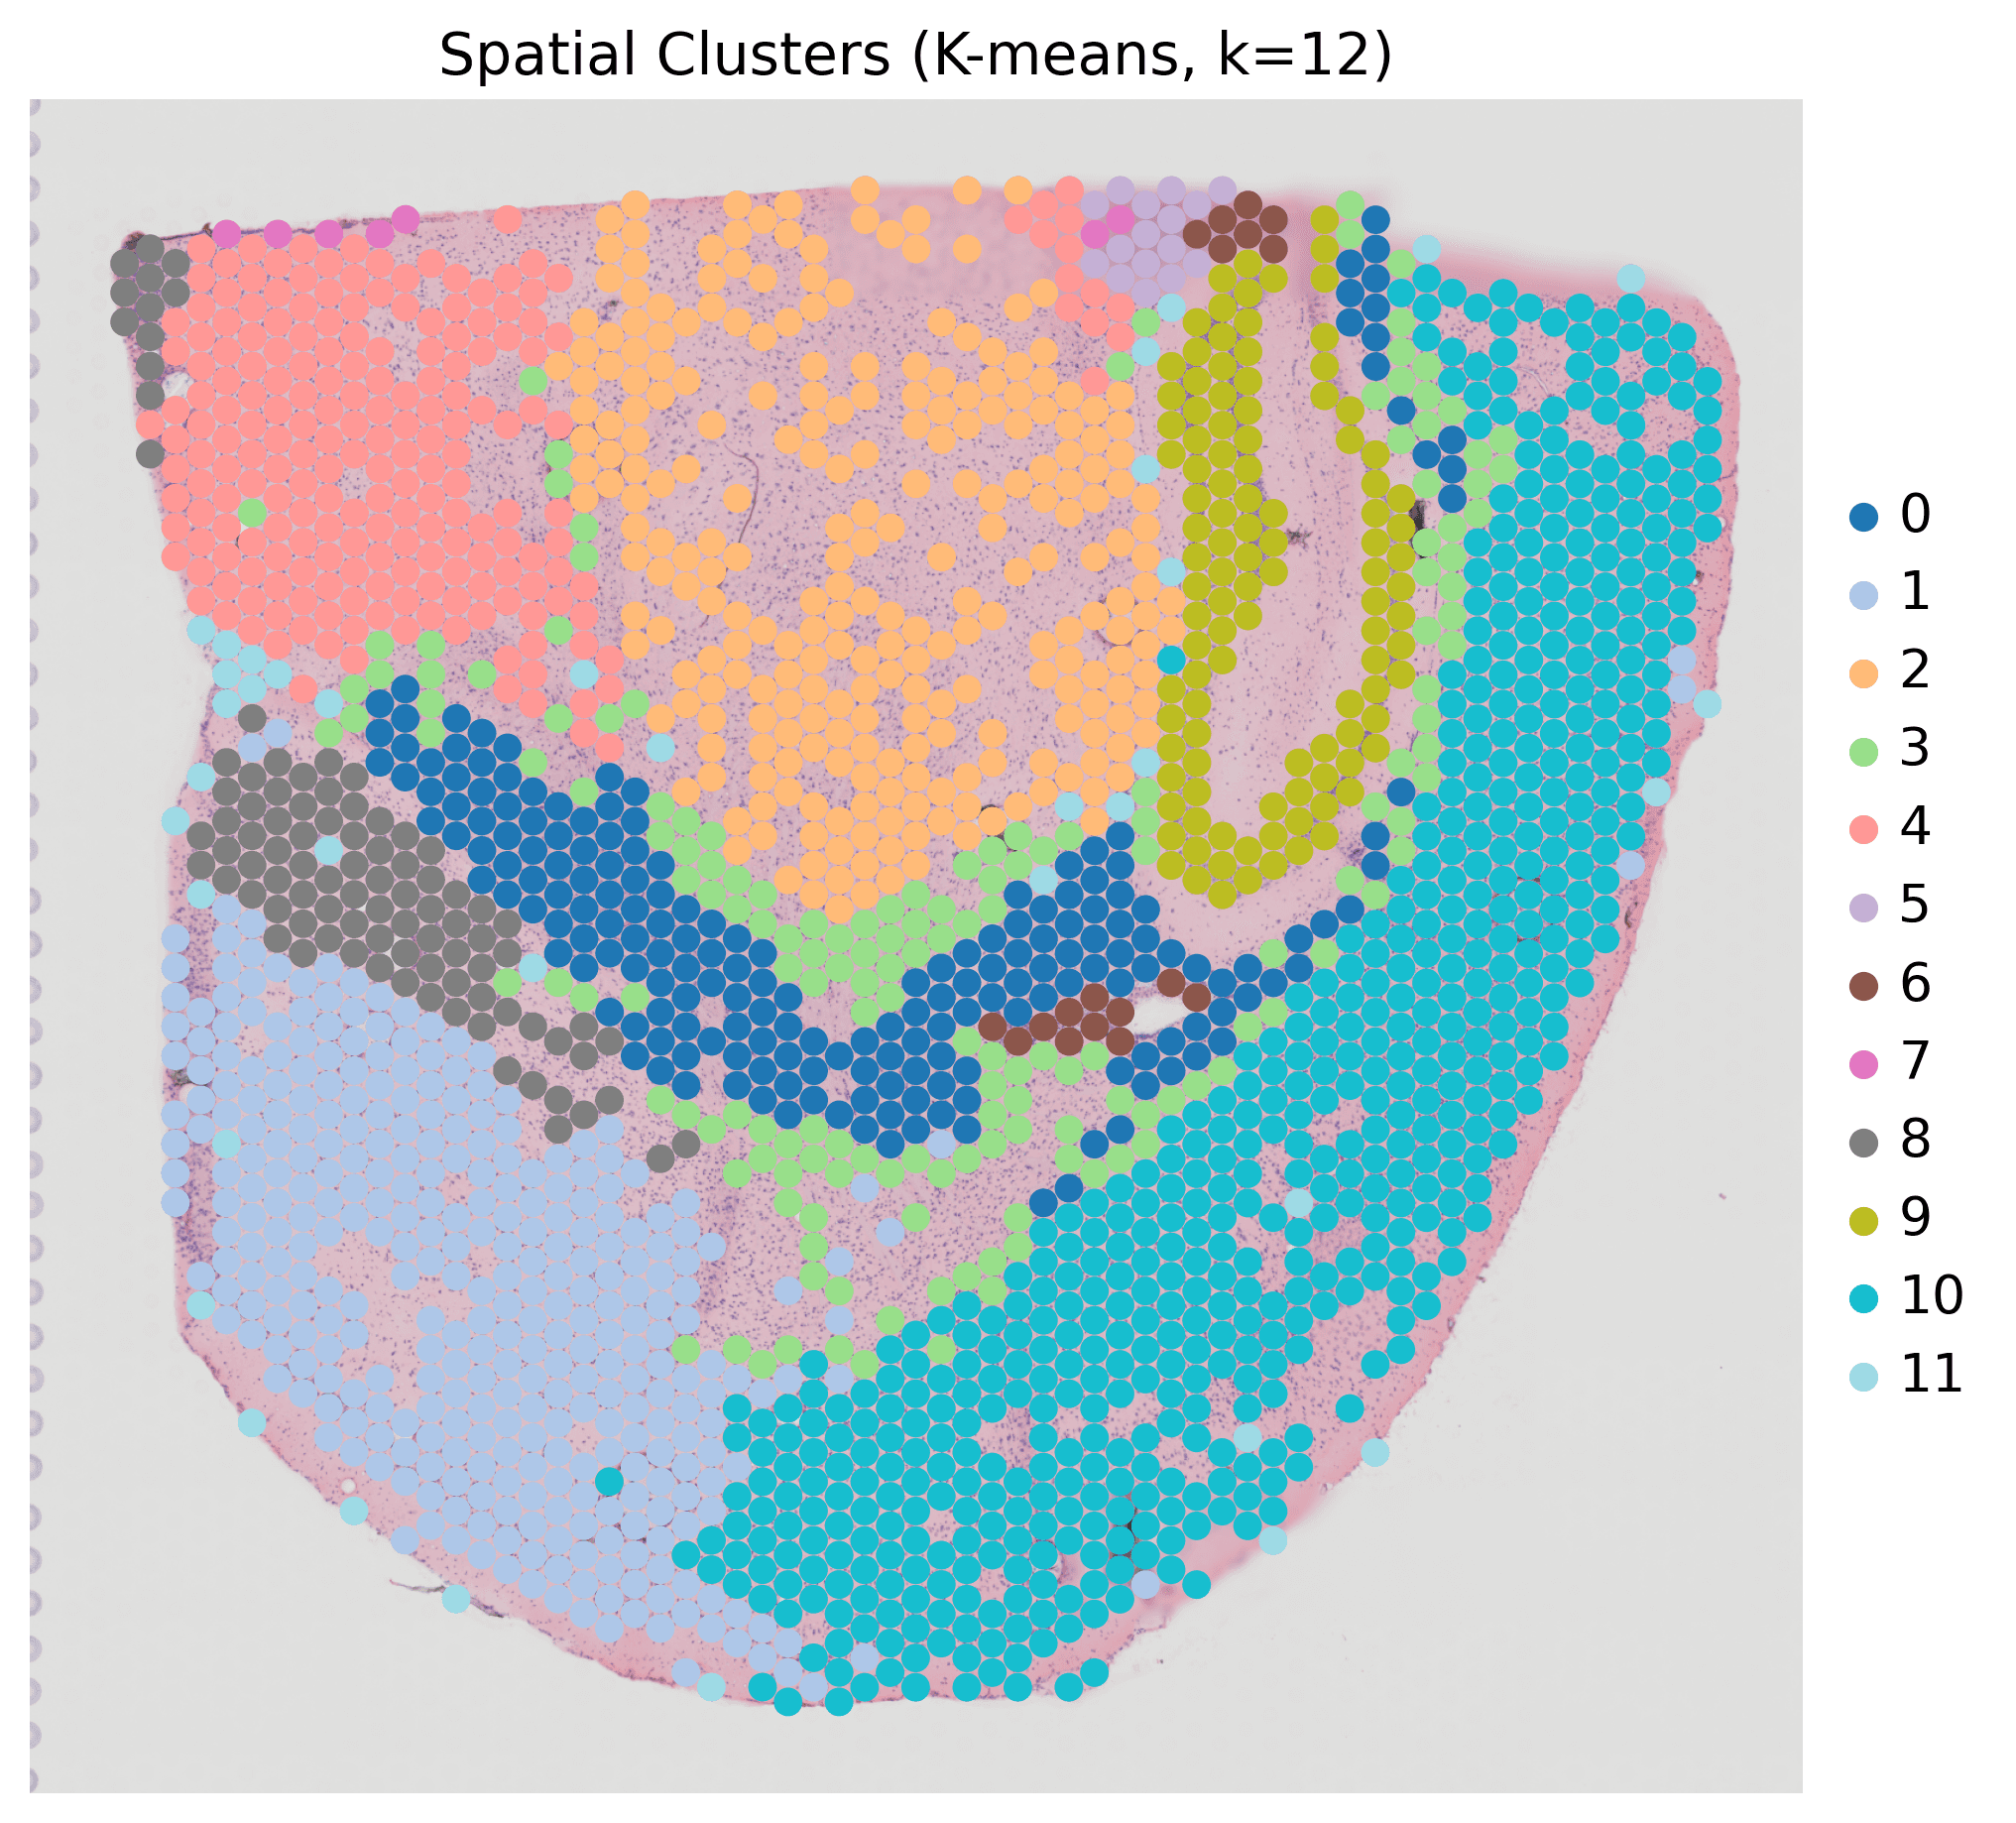
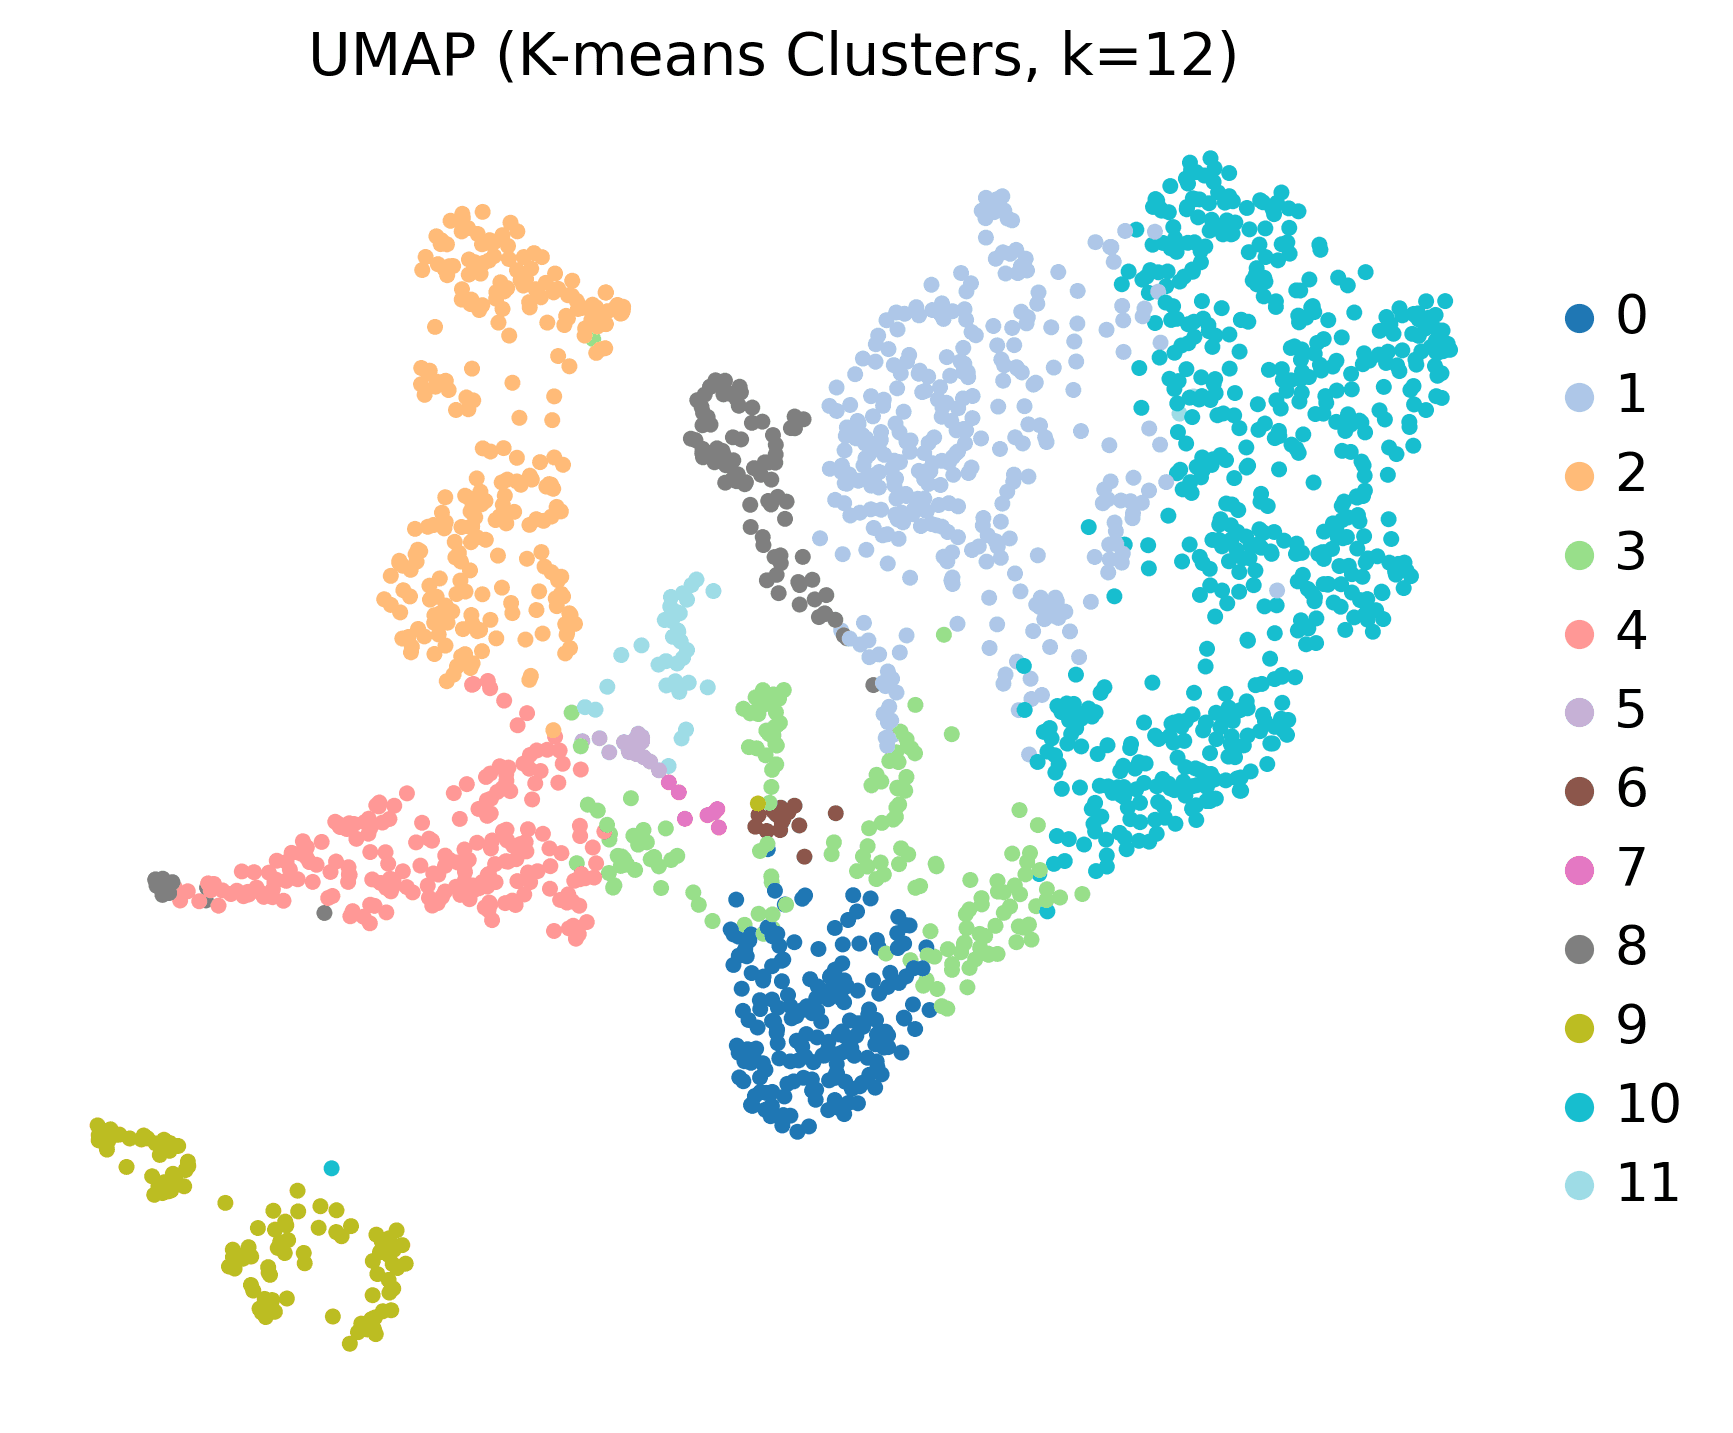
Unsupervised Spatial Clustering (Single Sample: HC1)
Method: PCA + K-means clustering (k=12)
Output: 12 spatial clusters with anatomically-defined regions
Key Finding: Successfully identified oligodendrocytes, neurons, choroid plexus, ependymal cells, and stromal regions with canonical marker genes
Pan-Sample Clustering (All 6 Samples)
Method: Quality filtering → SCTransform → Louvain clustering (resolution 0.5)
Retention: 10,839 spots (66% of 16,451 total)
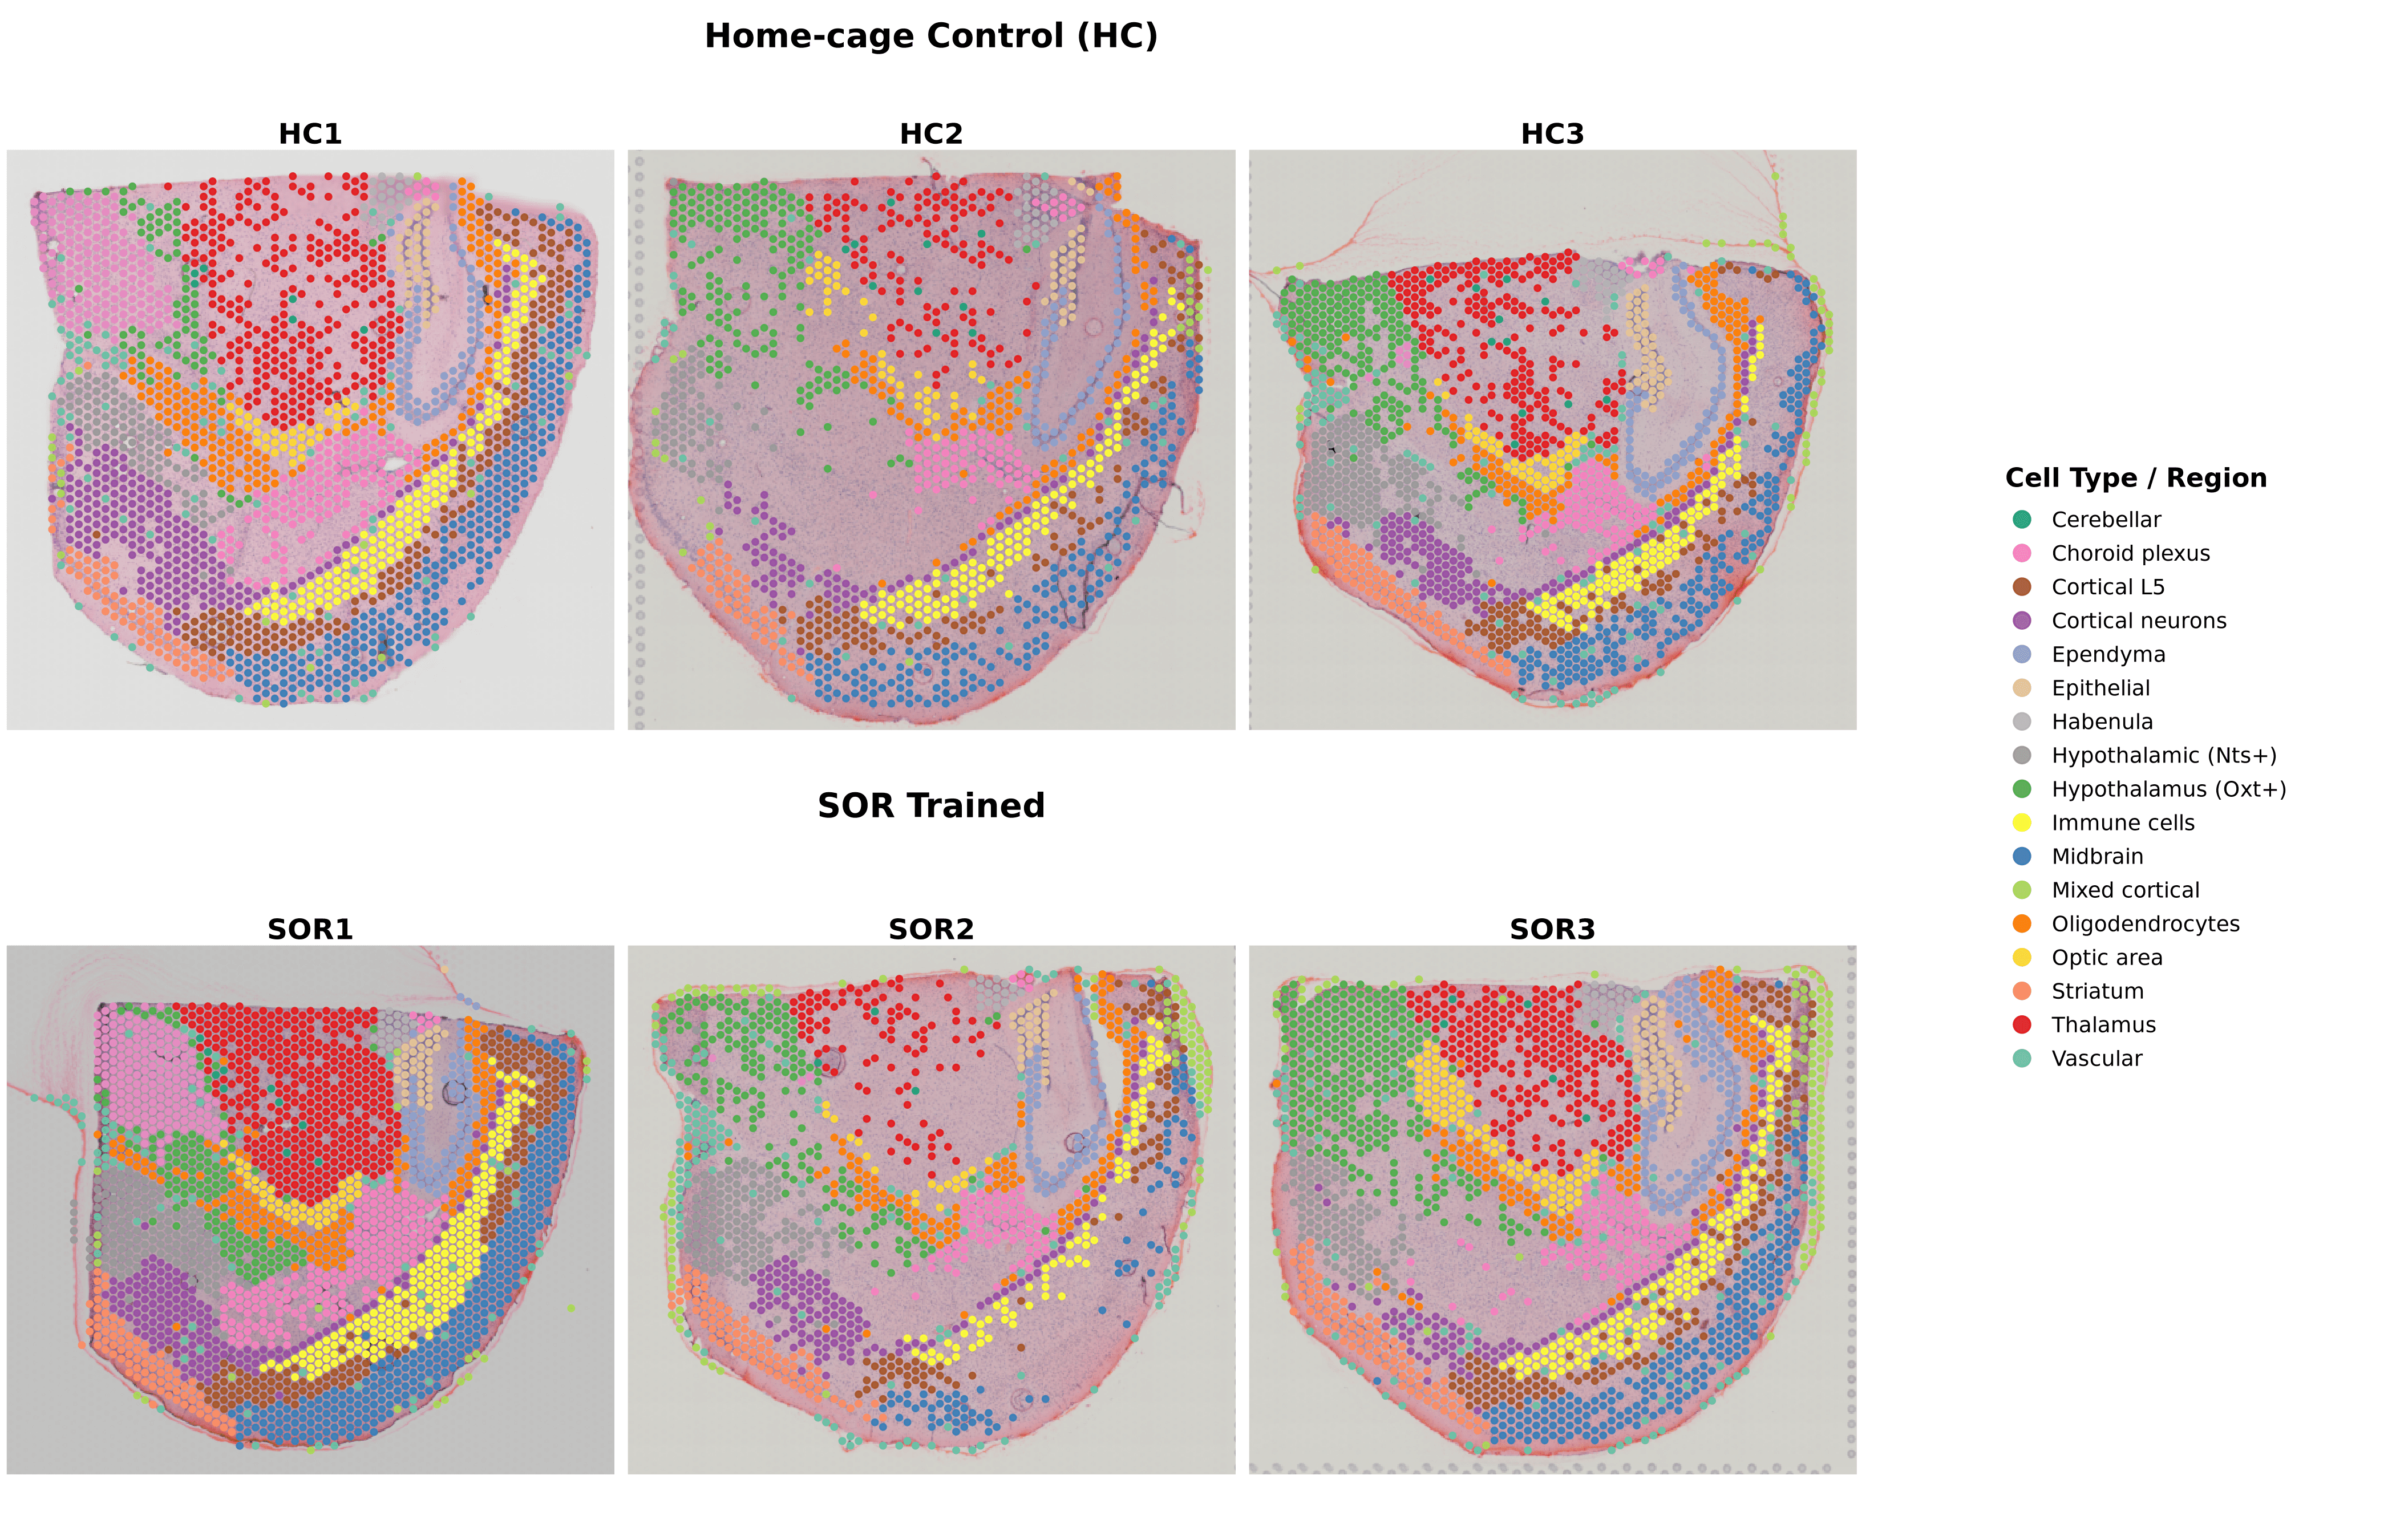
Output: 18 anatomically coherent spatial regions
Marker Genes: 16,743 significantly differentially expressed genes across regions
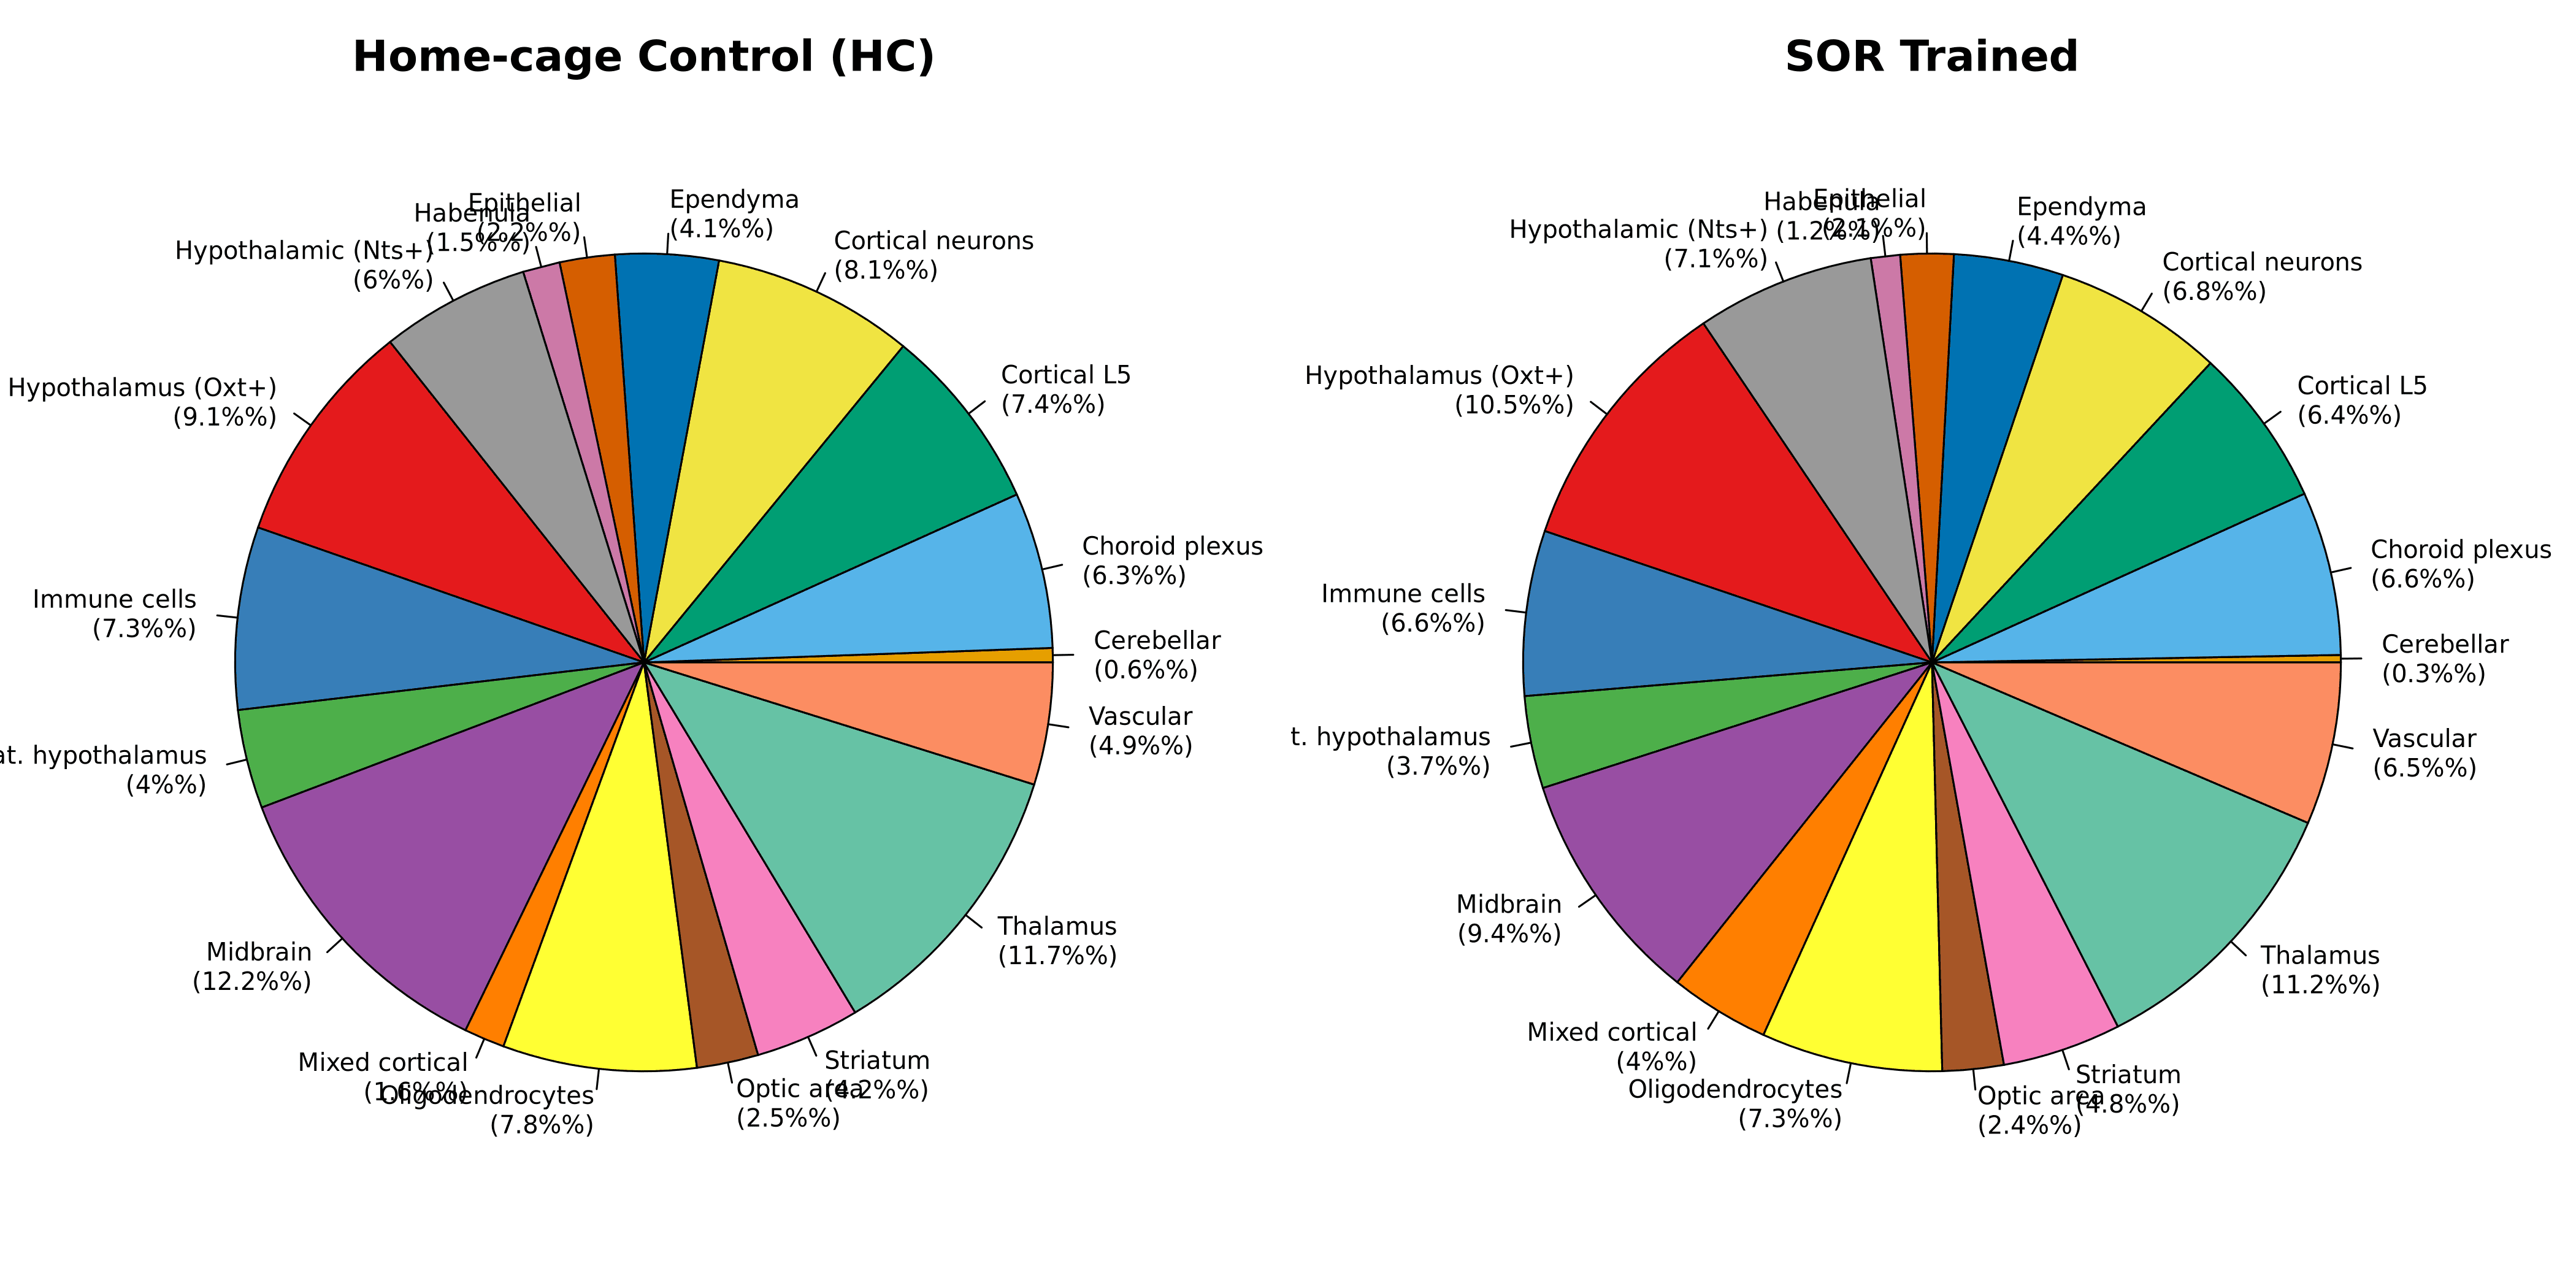
Condition Comparison: HC vs SOR (Proportional Analysis)
Comparison: Home-cage Control (n=3) vs SOR-trained (n=3)
Key Findings:
Thalamus: 11.7% (HC) vs 11.2% (SOR) — minimal change
Midbrain: 12.2% (HC) vs 9.4% (SOR) — −2.8% in SOR (dopaminergic/serotonergic circuits)
Hypothalamus (Oxt+): 9.1% (HC) vs 10.5% (SOR) — +1.4% in SOR
Mixed Cortical: 1.6% (HC) vs 4.0% (SOR) — +2.4% in SOR (potential learning plasticity)
Overall: Anatomical architecture highly conserved across conditions
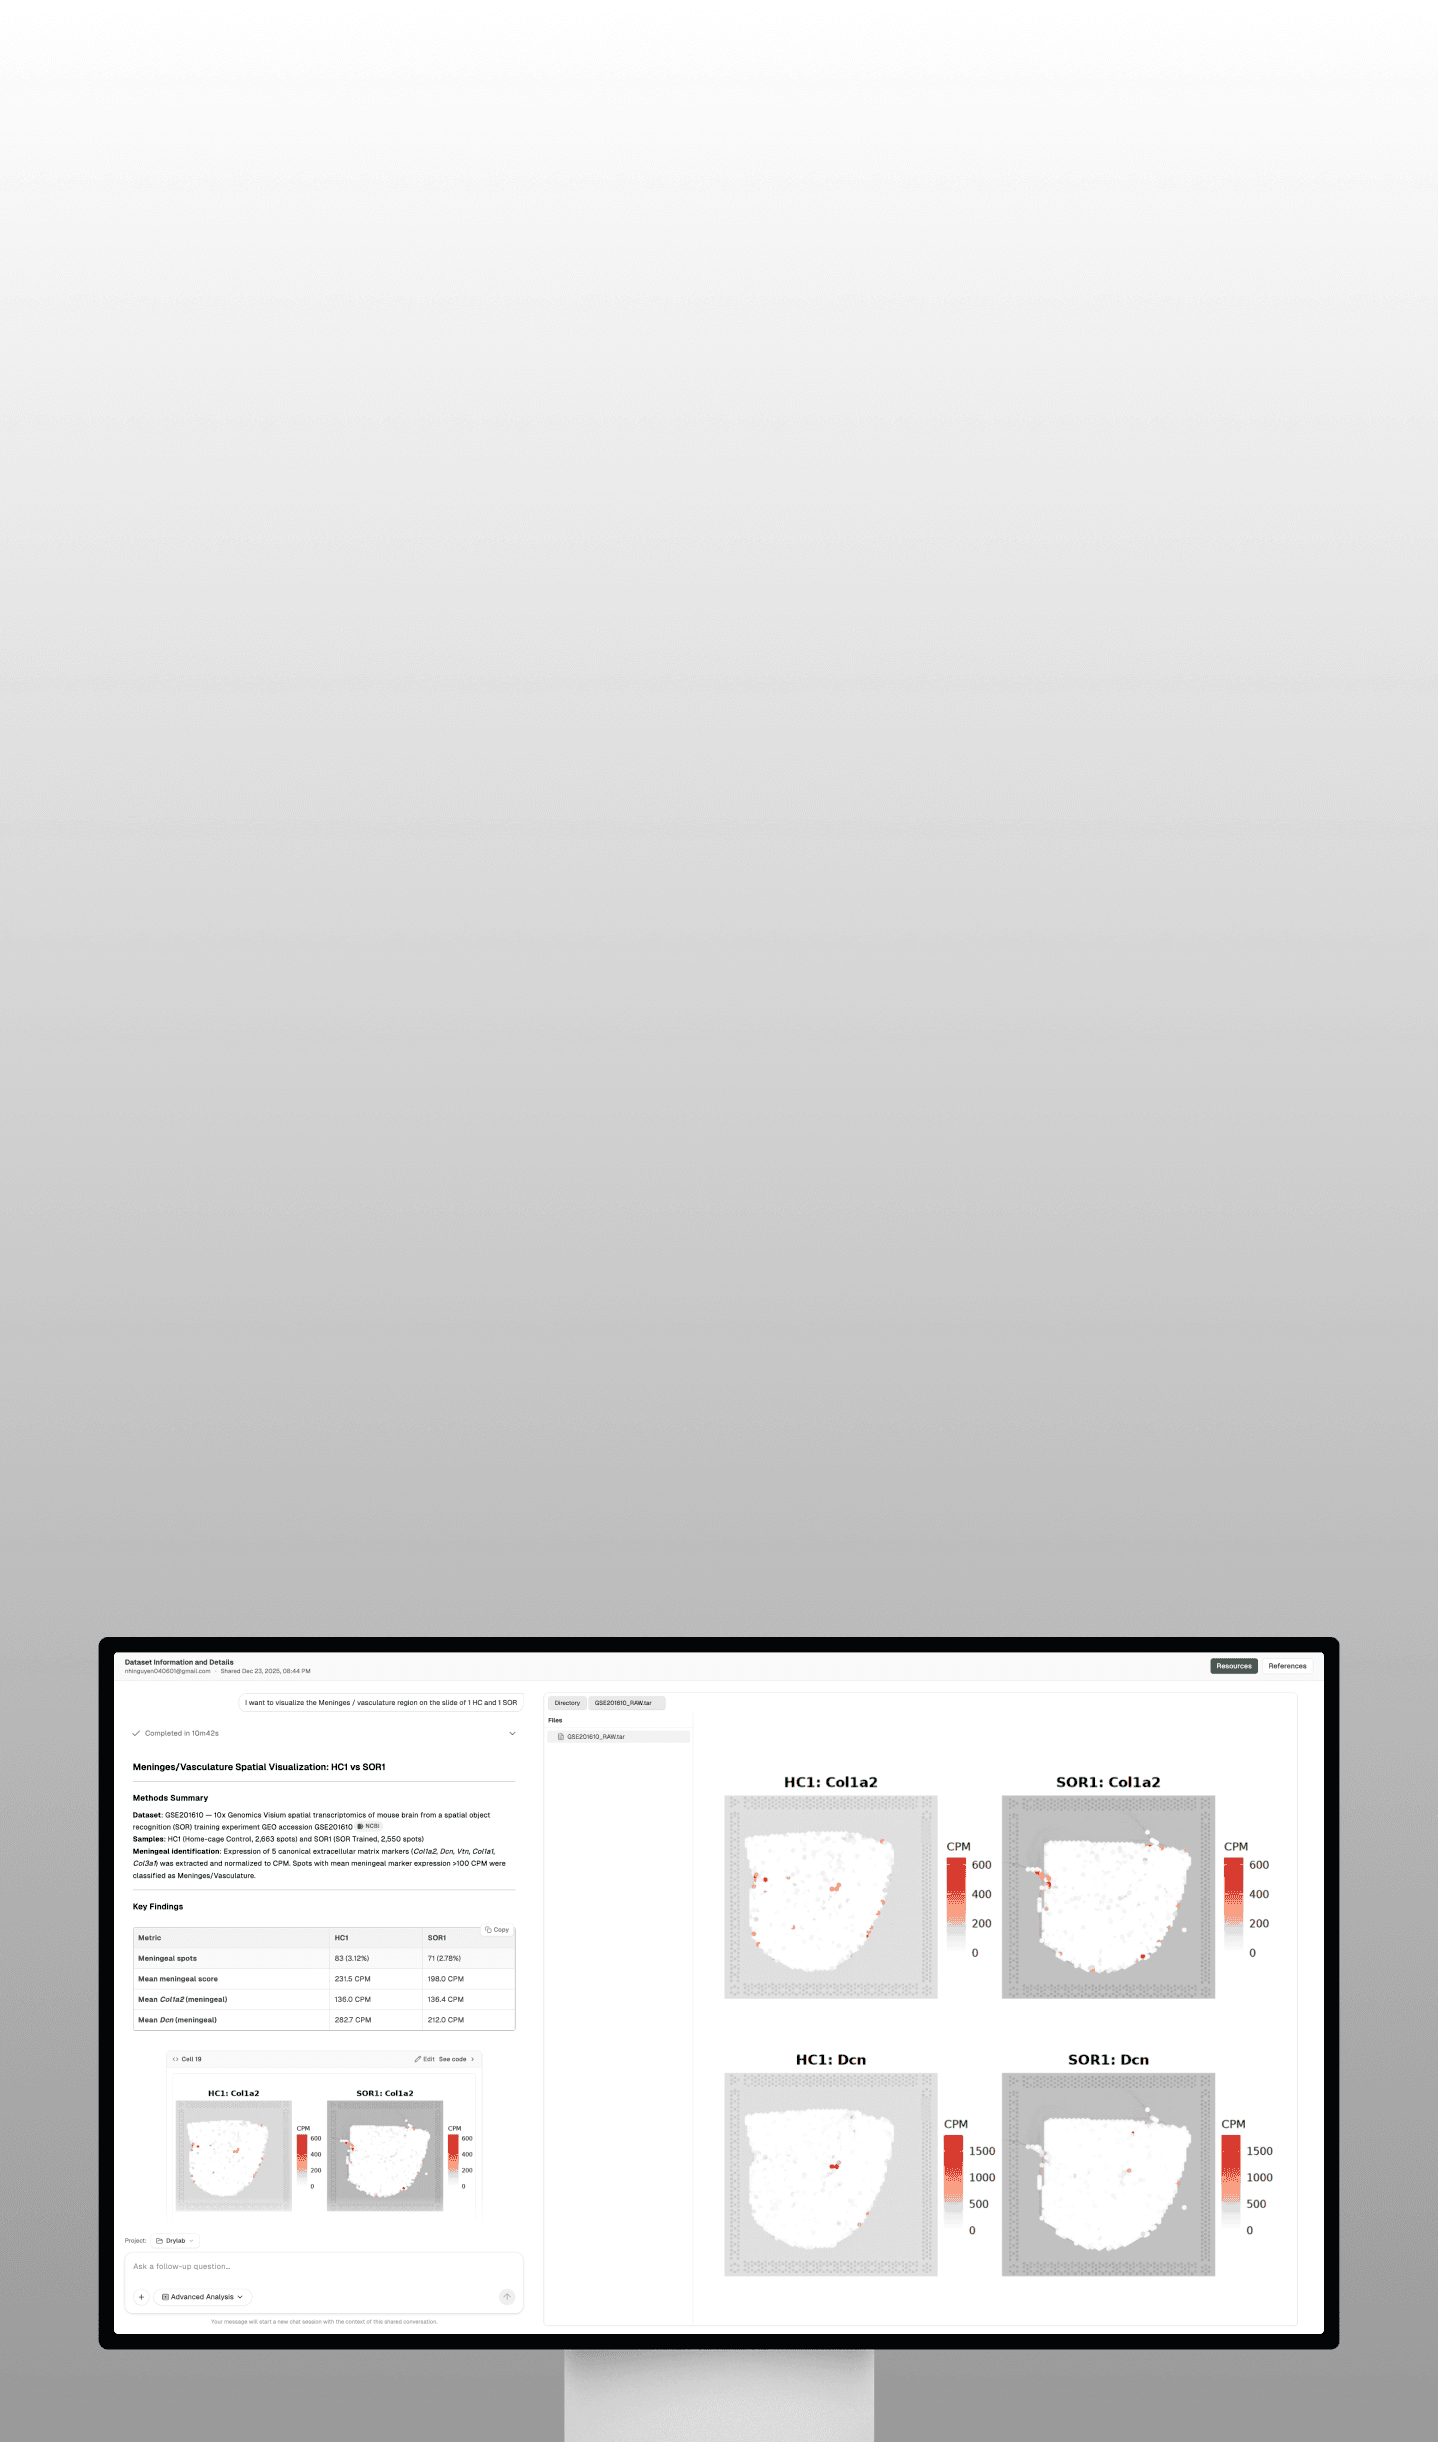
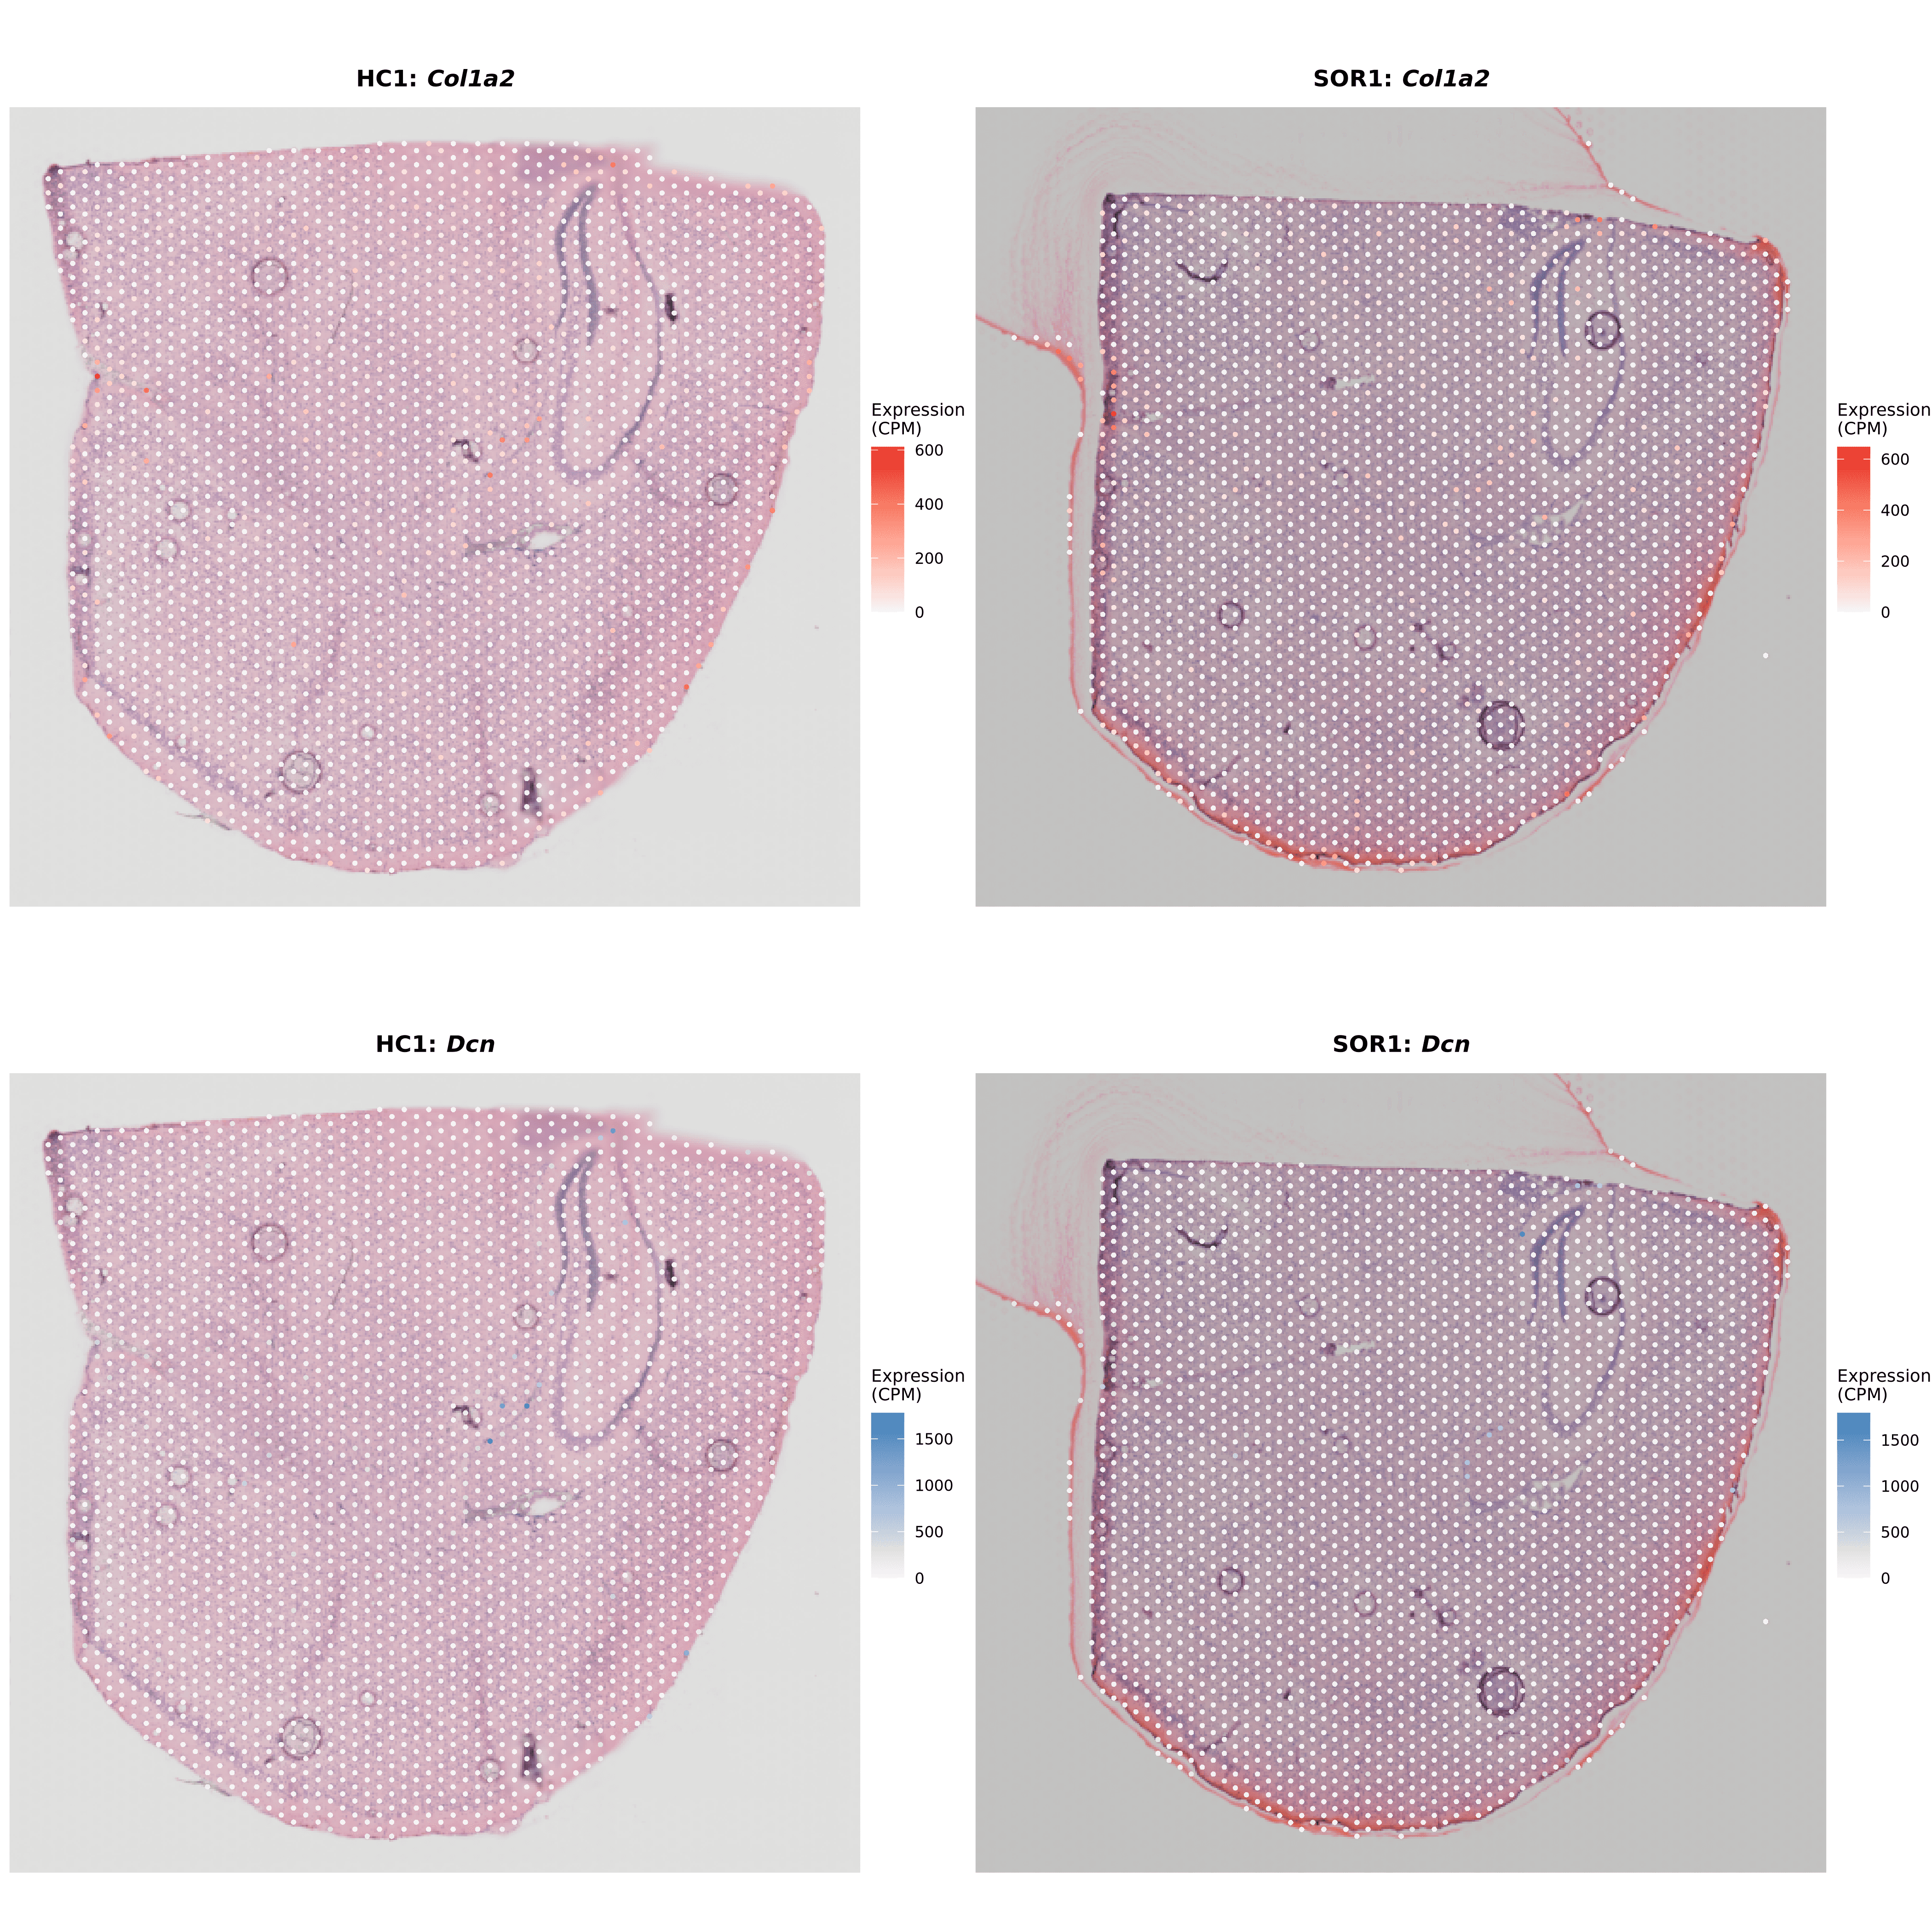
Meninges/Vasculature Spatial Localization (HC1 vs SOR1)
Markers Used: Col1a2, Dcn, Vtn, Col1a1, Col3a1
HC1 Results: 83 meningeal spots (3.12% of tissue), concentrated at periphery
SOR1 Results: 71 meningeal spots (2.78% of tissue)
Key Finding: Meningeal/vascular compartment is structurally preserved between conditions
Key Biological Insights
Intact Brain Architecture: Unsupervised clustering faithfully recapitulates known mouse brain anatomy with clear demarcation of major structures (thalamus, midbrain, cortex, hypothalamus, white matter, choroid plexus)
Training-Induced Compositional Shifts:
Midbrain reduction in SOR suggests potential modulation of dopaminergic/serotonergic circuits
Cortical increase in SOR may reflect learning-associated plasticity
Overall effect sizes are modest (<3% absolute change), requiring larger cohorts for statistical validation
Preserved Stromal/Vascular Compartment: Meningeal and vascular structures remain structurally similar between HC and SOR conditions
Recommended Follow-Up Analyses
Reference-based deconvolution: Apply RCTD or Cell2location with Allen Brain Atlas scRNA-seq for higher cell type resolution
Statistical testing: Formal compositional data analysis (ALDEx2, scCODA) for differential abundance
Spatial differential expression: Identify genes with condition-dependent expression within specific brain regions
Pathway enrichment: Characterize functional programs in regions showing compositional shifts
Larger sample size: Current n=3 per group limits statistical power; recommend n≥5 for robust conclusions