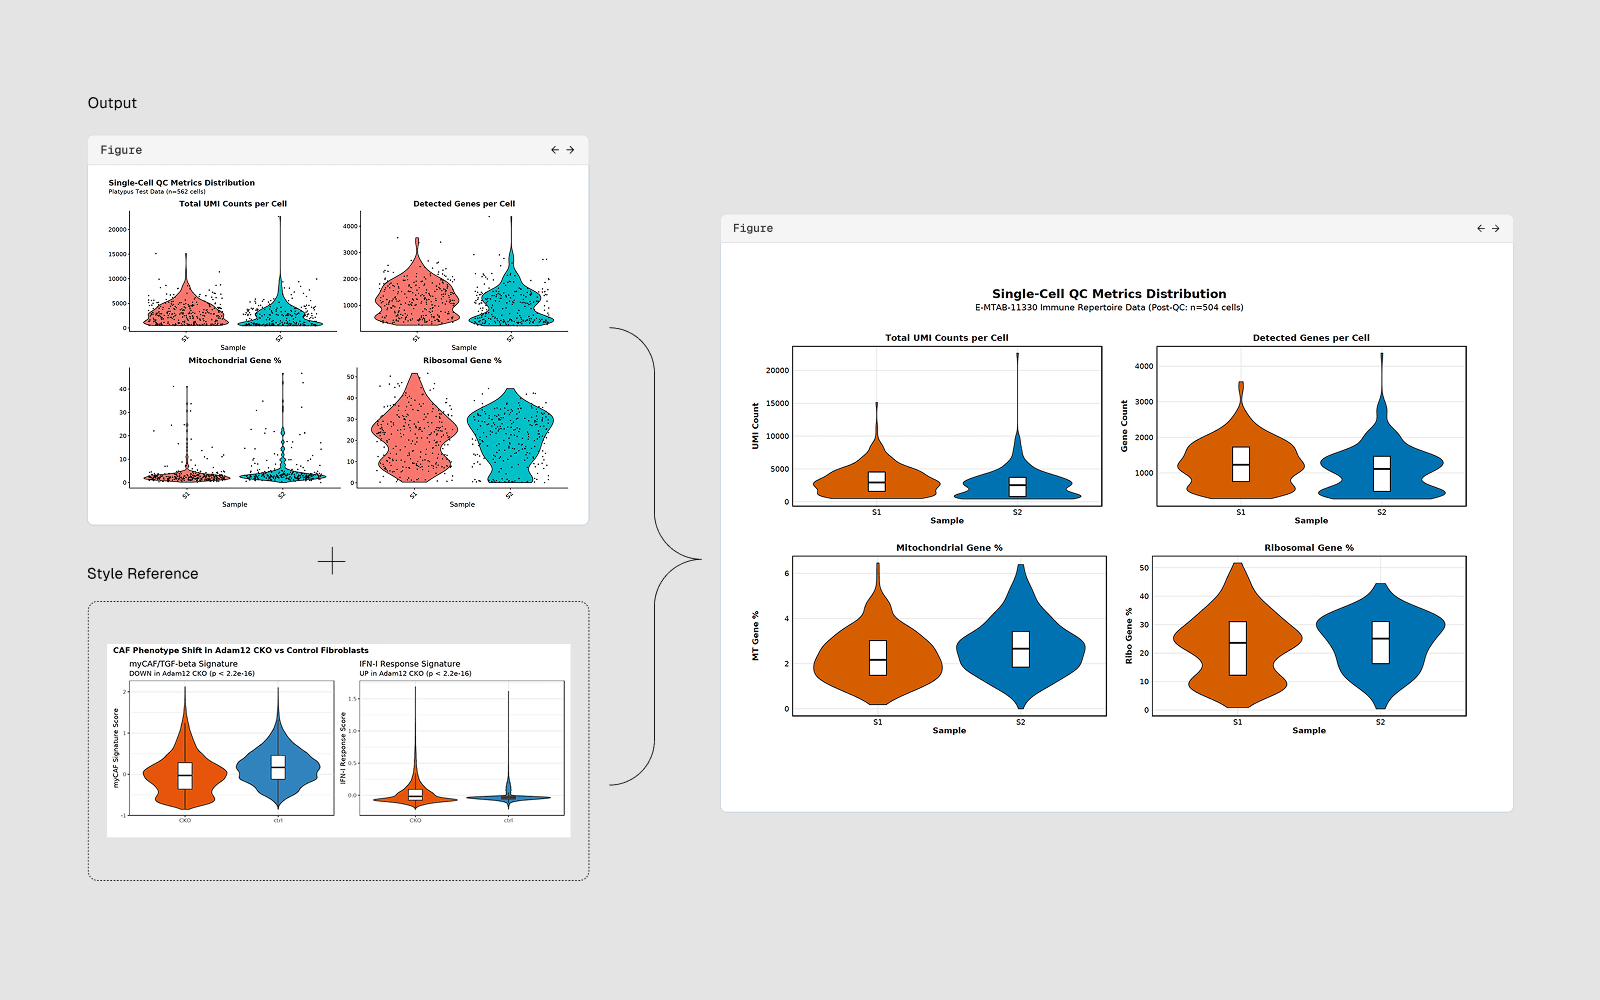
4.1 How to Edit Graph/Plot Style Using a Reference Image in Drylab
Tips

You provide a reference image of a plot style you want to replicate, and the AI analyzes it and rewrites your plotting code to match that style.
Reference Image → AI analyzes style → Rewrites your plot code → Matched output
What Style Elements the AI Can Extract and Apply
Element | Example |
|---|---|
Color palette | Exact hex colors for categories or colormaps |
Font | Family (serif, sans-serif), size, weight |
Axes style | Spines on/off, tick direction, tick length |
Background | White, light grey, dark theme |
Grid | On/off, major/minor, color, linestyle |
Legend | Position, frame, font size, number of columns |
Markers | Shape, size, edge color, transparency |
Line style | Width, dash pattern, color |
Figure size | Width x height in inches or mm |
Colorbar | Position, label, tick spacing |
How to Edit Graph/Plot Style Using a Reference Image in Drylab
Step 1
Upload your reference image
Click the paperclip/attachment icon in the chat input bar, or paste an image from the clipboard (Ctrl+V/Cmd+V): [Paste image] Make my scatter plot look like this. Match the background color, marker style, grid lines, and colorbar style exactly.
Select your reference image (
.png,.jpg,.pdf)Or drag it directly into the chat
Step 2
Describe what you want:
"Here is a reference plot from a Nature paper. Restyle my current plot figure1.png to match this style:
Same color palette/ Same font size and family/ Same axis style (no top/right spines) / Same legend position"`
Tips for Better Style Matching
Use high-resolution reference images
Higher resolution images allow the AI to detect visual details more accurately.Crop the reference figure
Crop the image to the plot area only. Removing surrounding text helps the AI focus on the visual style.
Mention your current plot file
Use @filename to reference the figure you want to modify.
Iterate
If the result is close but not perfect, refine the prompt.
